
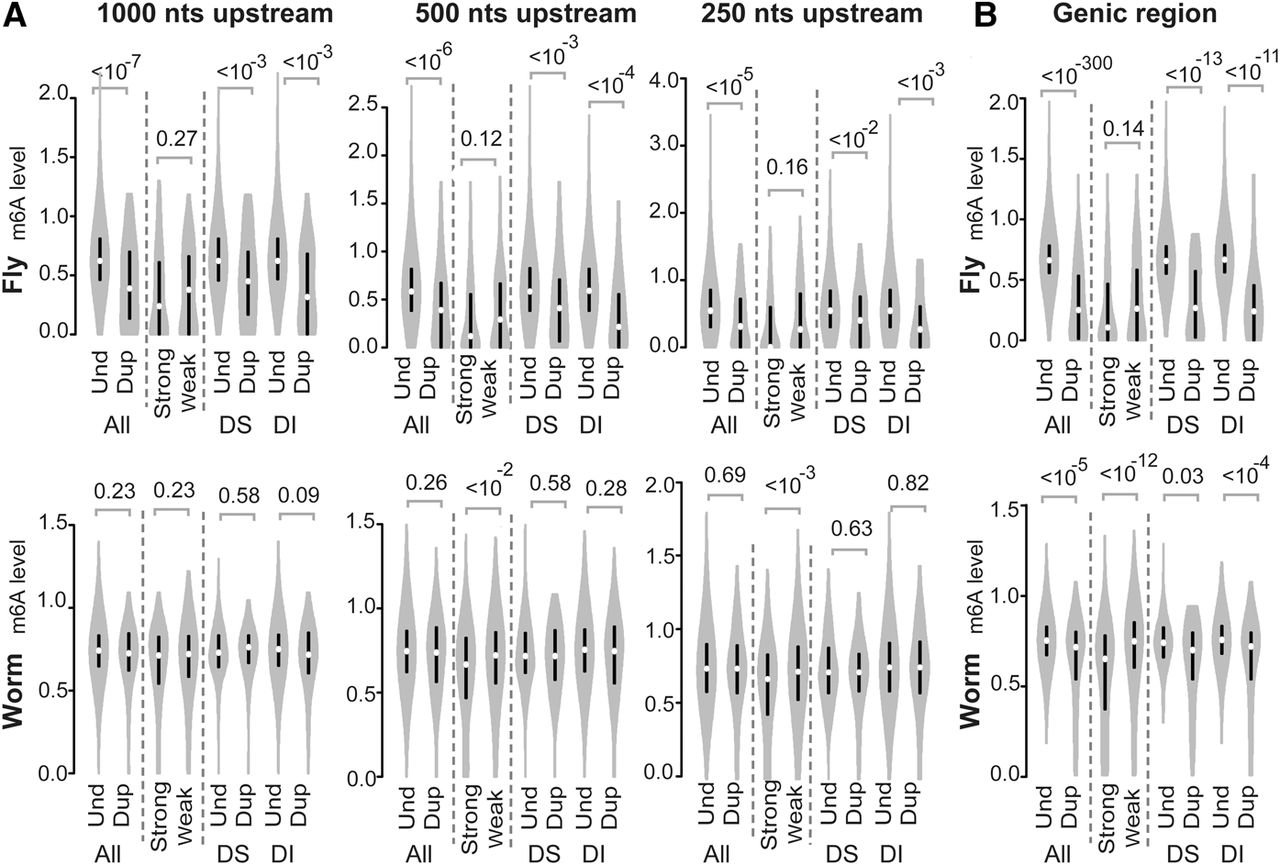
Figure 1.
Violin plots of the adenine DNA methylation levels (m6A) detected in the following: (A) the promoter regions (1000, 500, and 250 nt upstream of the TSS) and (B) gene bodies (from the TSS to the TTS) of D. melanogaster (fly; top) and C. elegans (worm; bottom). P-values were determined with the Mann-Whitney U test and are associated with arched gray lines at the top of each panel that indicate the values that were compared. (Und) unduplicated; (Dup) duplicated; (Strong) strongly expressed; (Weak) weakly expressed; (DS) ortholog sets containing dosage-sensitive genes; (DI) ortholog sets containing only dosage-insensitive genes.


