
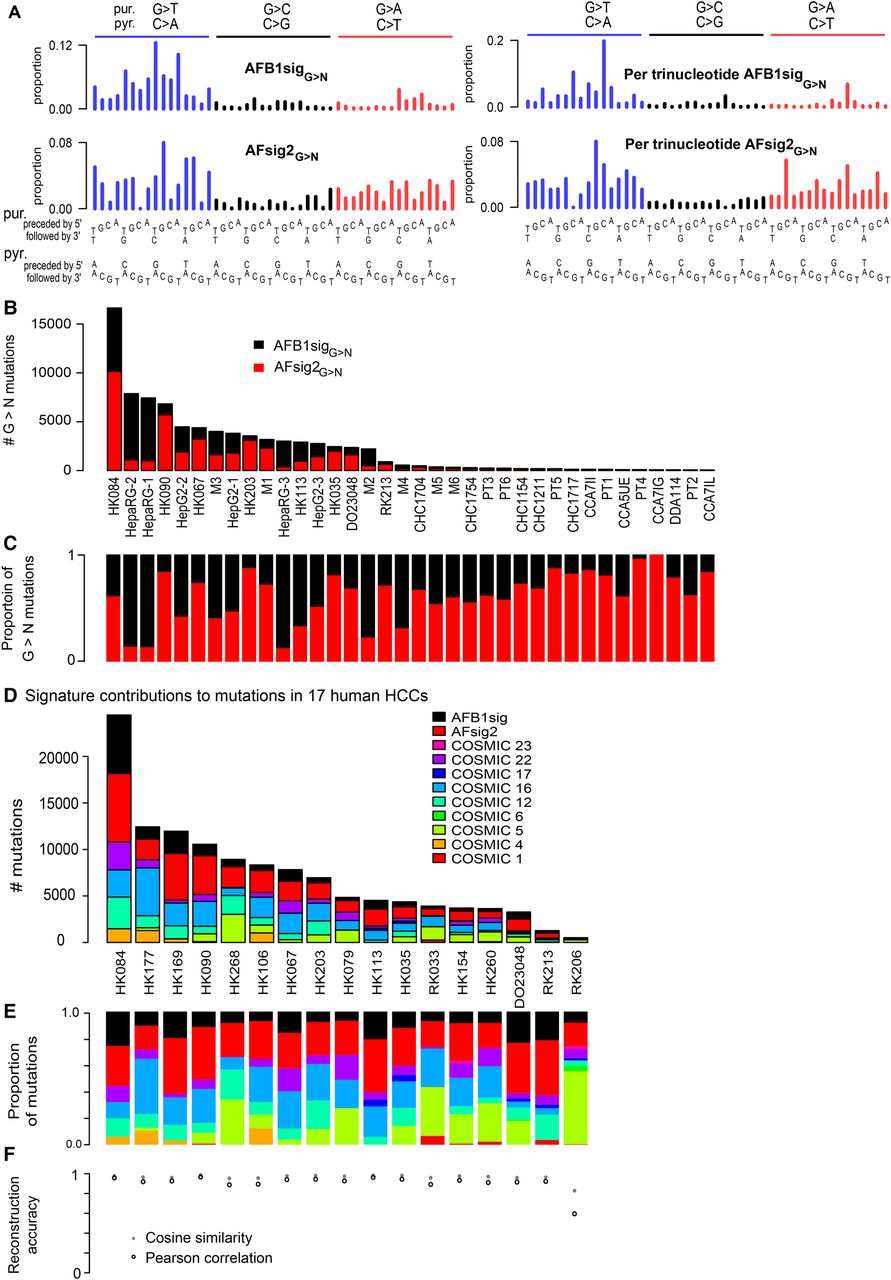
Aflatoxin signatures in human HCCs. (A) NMF decomposes the G > N spectra from experimental AFB1 exposure and likely aflatoxin-associated HCCs into two components, denoted AFB1sigG>N and AFsig2G>N. The left-hand side of the panel shows the signatures, as is conventional, based on trinucleotide frequencies in the human genome; the right-hand side shows them in frequencies per trinucleotide—equivalent to assuming all trinucleotides are equally common. (B,C) AFB1sigG>N (black) almost completely captures the spectra of HepaRG cell lines; AFsig2G>N (red) almost completely captures the spectra of some HCCs (e.g., HK067, HK203), while the mutations in HepG2, the mouse tumors, and some HCCs are most accurately reconstructed by a mixture of AFB1sigG>N and AFsig2G>N. (D,E) Nonnegative matrix factorization of selected HCCs using mutational signatures known to occur in HCCs, plus extensions of AFB1sigG>N and AFsig2G>N with A > N proportions set to 0, the latter denoted AFB1sig and AFsig2. (D) Absolute mutation numbers assigned to each signature. (E) Proportions of mutations assigned to each signature. (F) Reconstruction accuracy is generally good, with the exception of RK206, which has few mutations and a hard-to-reconstruct mutation spectrum outside of G > T mutations, partly due to spikes at TCA:TGA > TTA:TAA and CTG:CAG > CCG:CGG.


