
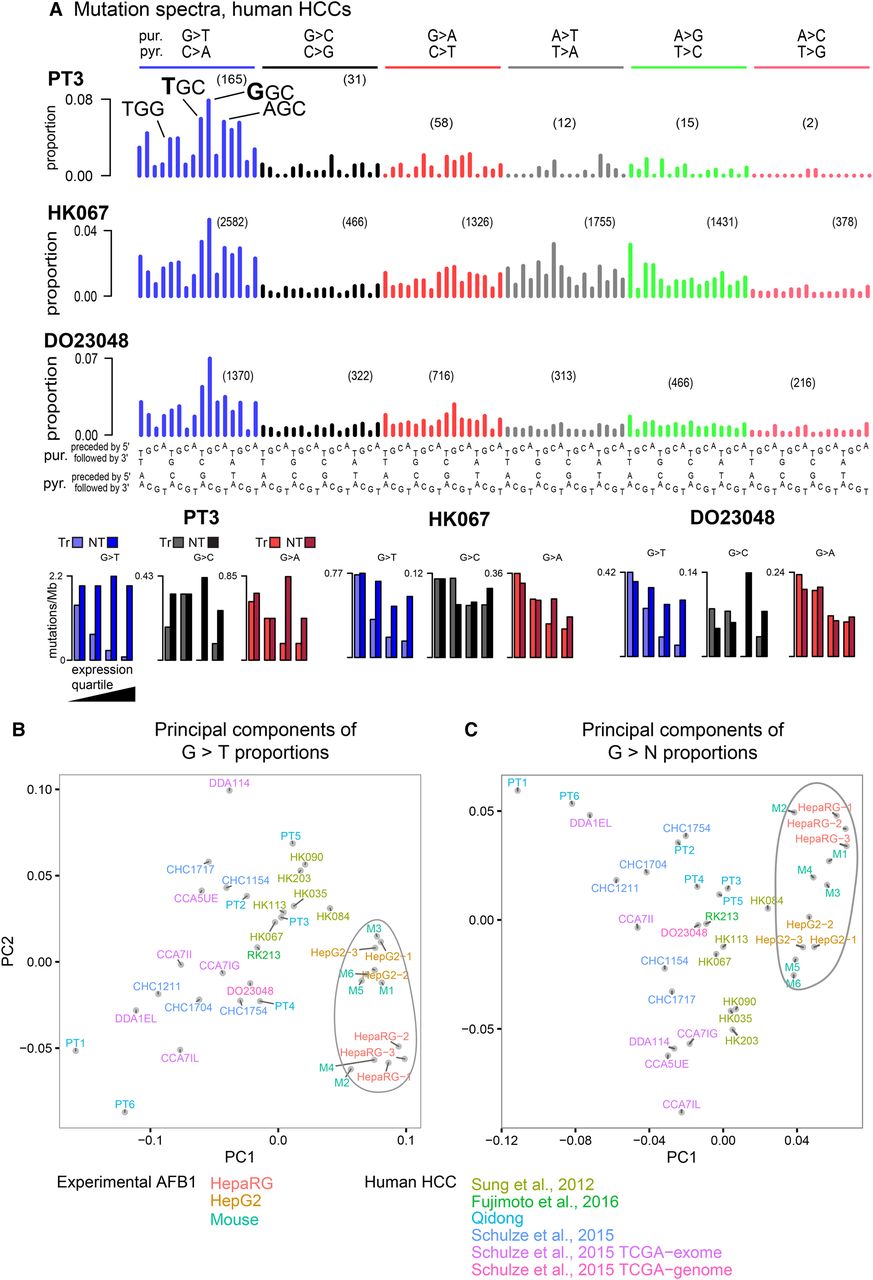
Figure 5.
(A) Somatic mutation spectra and transcriptional-strand bias for initial study of aflatoxin signatures in example human HCCs with likely aflatoxin exposure. Transcribed strand (Tr); nontranscribed strand (NT). Principal component analysis of (B) G > T and (C) G > N mutations for AFB1 experimental data (enclosed in irregular ovals) and HCCs with likely high aflatoxin exposure.


