
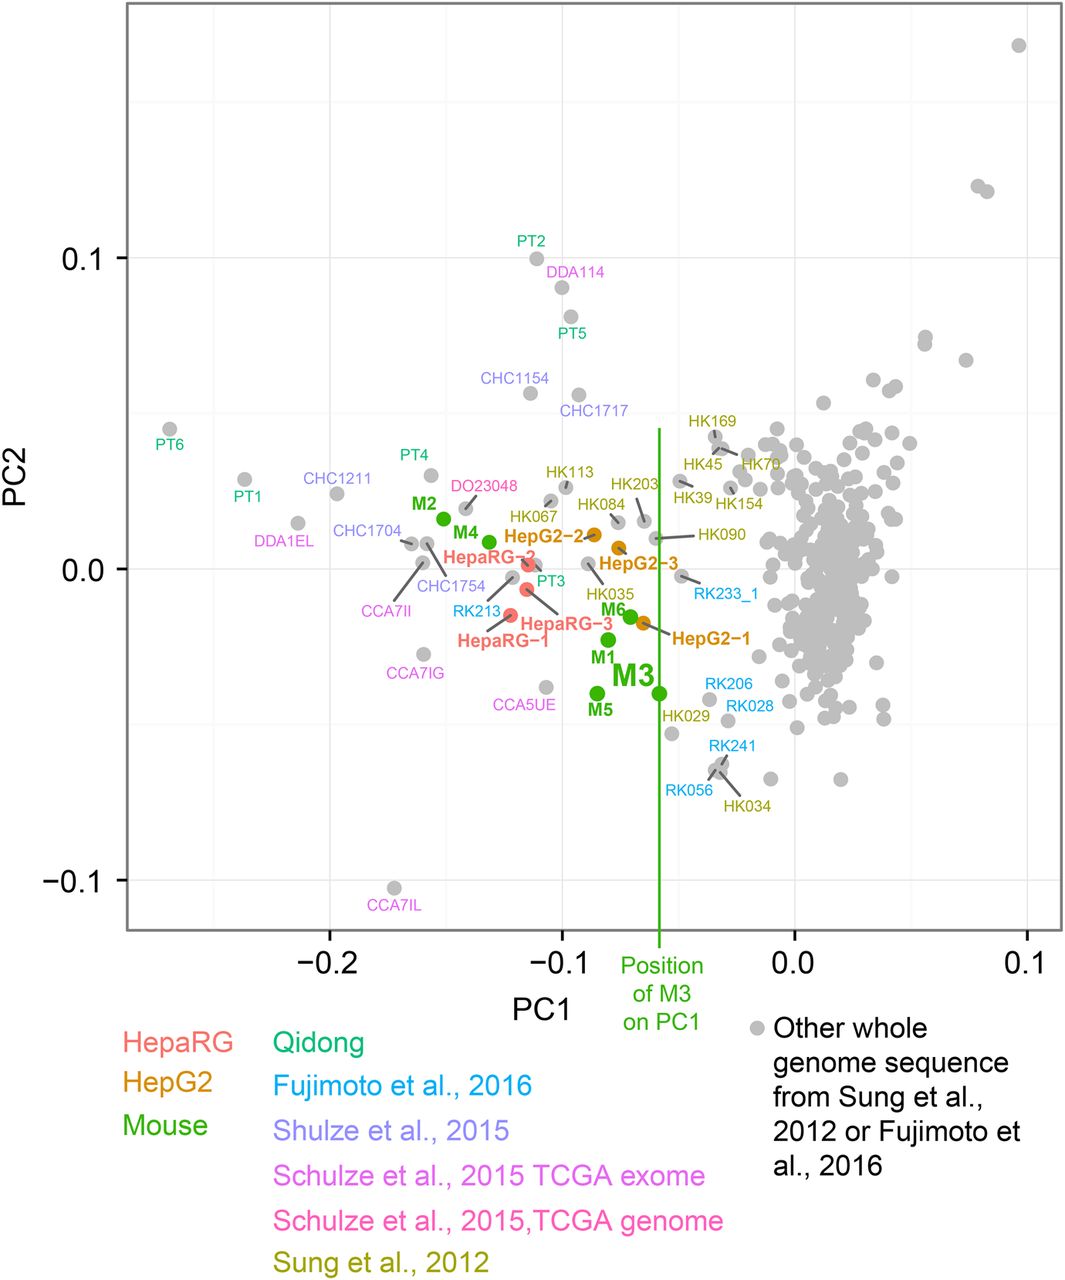
Figure 4.
Selection of likely aflatoxin-associated HCCs by principal components analysis on the proportions of G > T mutations in trinucleotide context. Vertical green line indicates the value of M3 in PC1, which was used as a threshold for selecting WGS HCCs likely exposed to aflatoxins for further study: One HCC identified from WES data in Schulze et al. (2015) for which WGS data was subsequently available (DO23048), six from Sung et al. (2012), and one HCC from Fujimoto et al. (2016). As expected due to the higher relative sampling variance in WES spectra due to small numbers of mutations, these were more variable than WGS spectra.


