
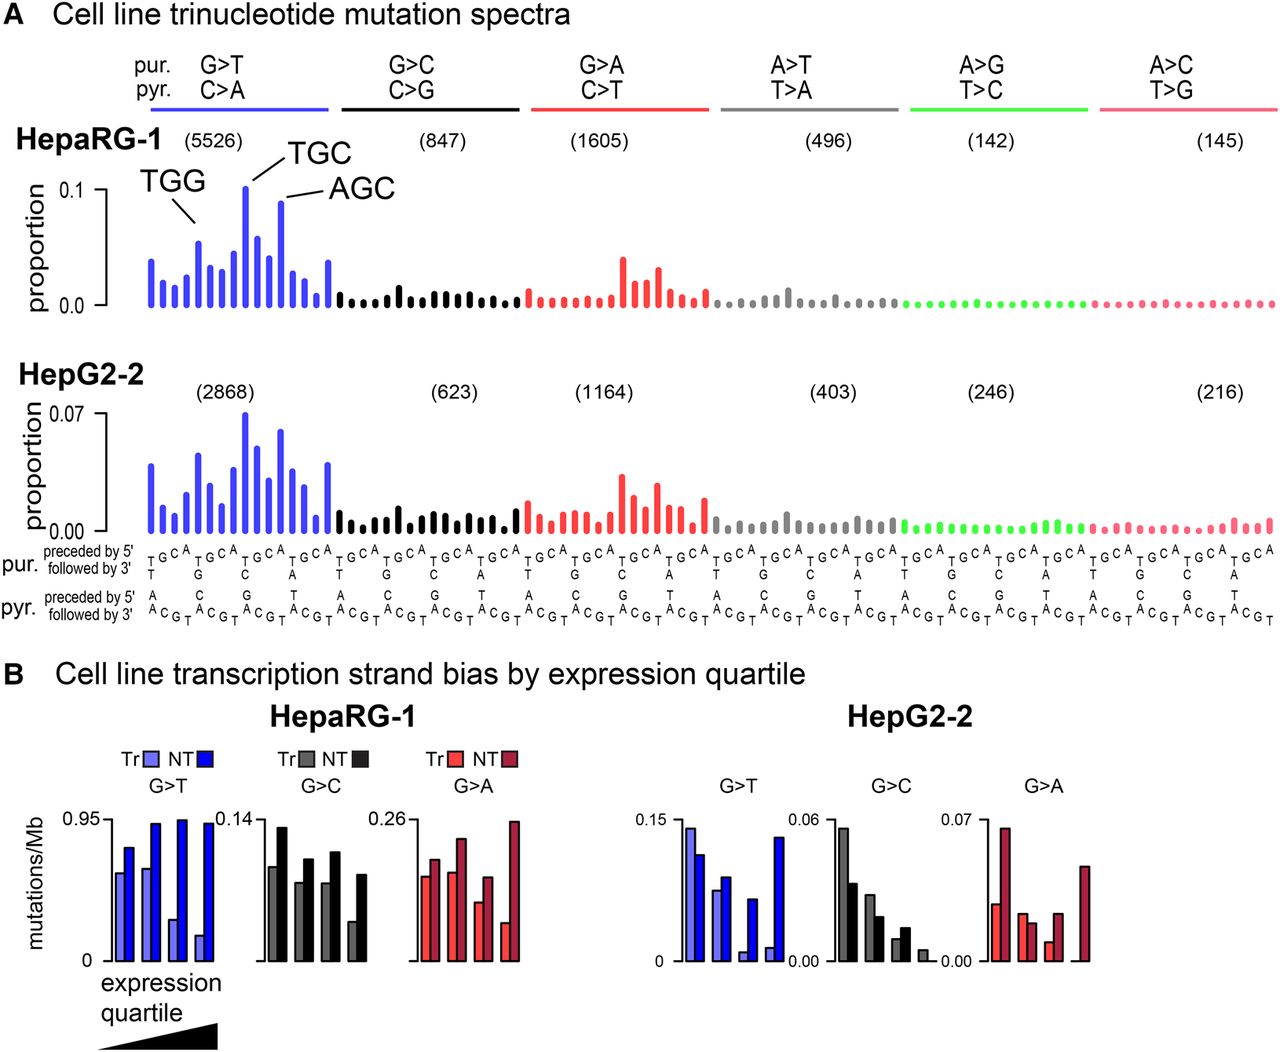
(A) Representative human-cell line trinucleotide mutation spectra grouped by mutations from guanine (G > T, G > C, G > A) and adenine (e.g., A > T, A > G, A > C). The most frequent G > T mutations are indicated (TGG > TTG, TGC > TTC, AGC > ATC). The number of mutations in in each mutation class (e.g., G > T) are indicated in parentheses. As there was little variation between replicates within each cell line, we show all individual spectra in Supplemental Figure S1. (B) Extreme transcription-strand bias for genes with high expression levels; see Supplemental Figure S2 for transcription-strand bias for all cell line replicates. Transcribed strand (Tr); nontranscribed strand (NT).


