
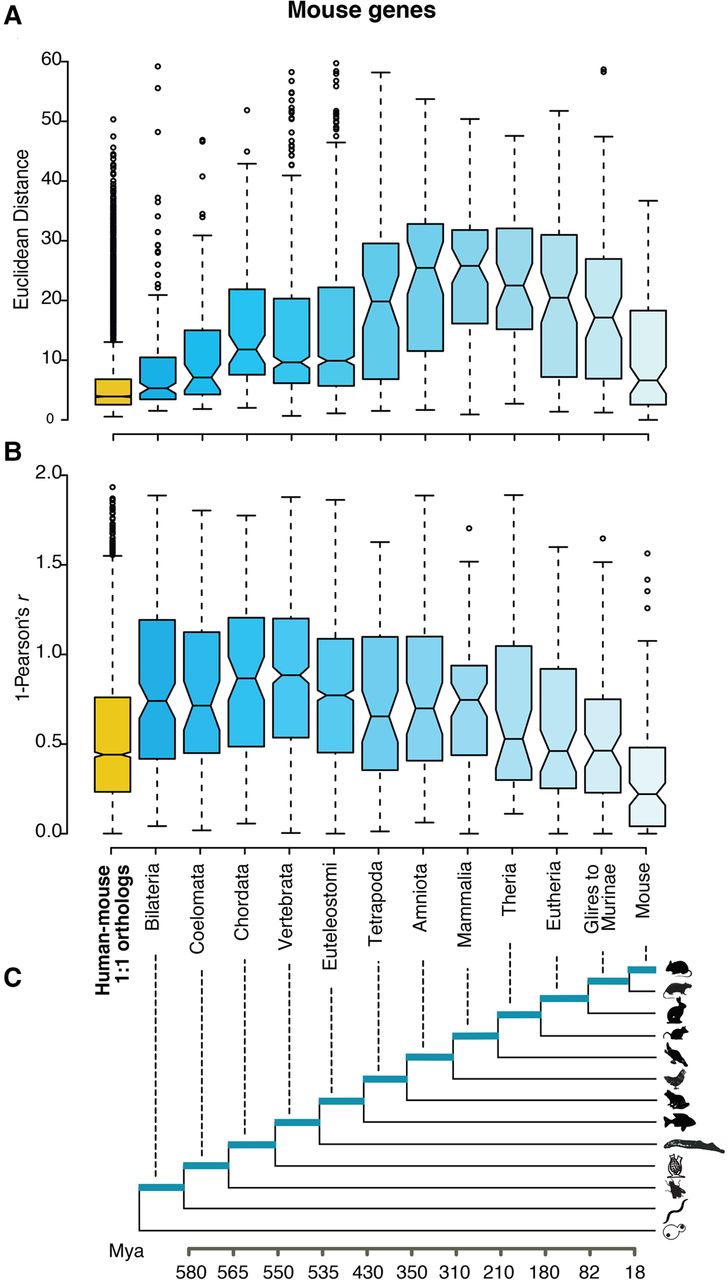
Figure 1.
Expression divergence of single-copy human-mouse orthologs (yellow) and age-grouped mouse paralogs (blue) based (A) on Euclidean distances and (B) on Pearson's correlation coefficient r (displayed as 1−r). Paralogs are grouped into age classes according to gene tree topology. (C) The species tree shows divergence times in million years, with highlighted branches corresponding to the evolutionary groups for which divergence was inferred.


