
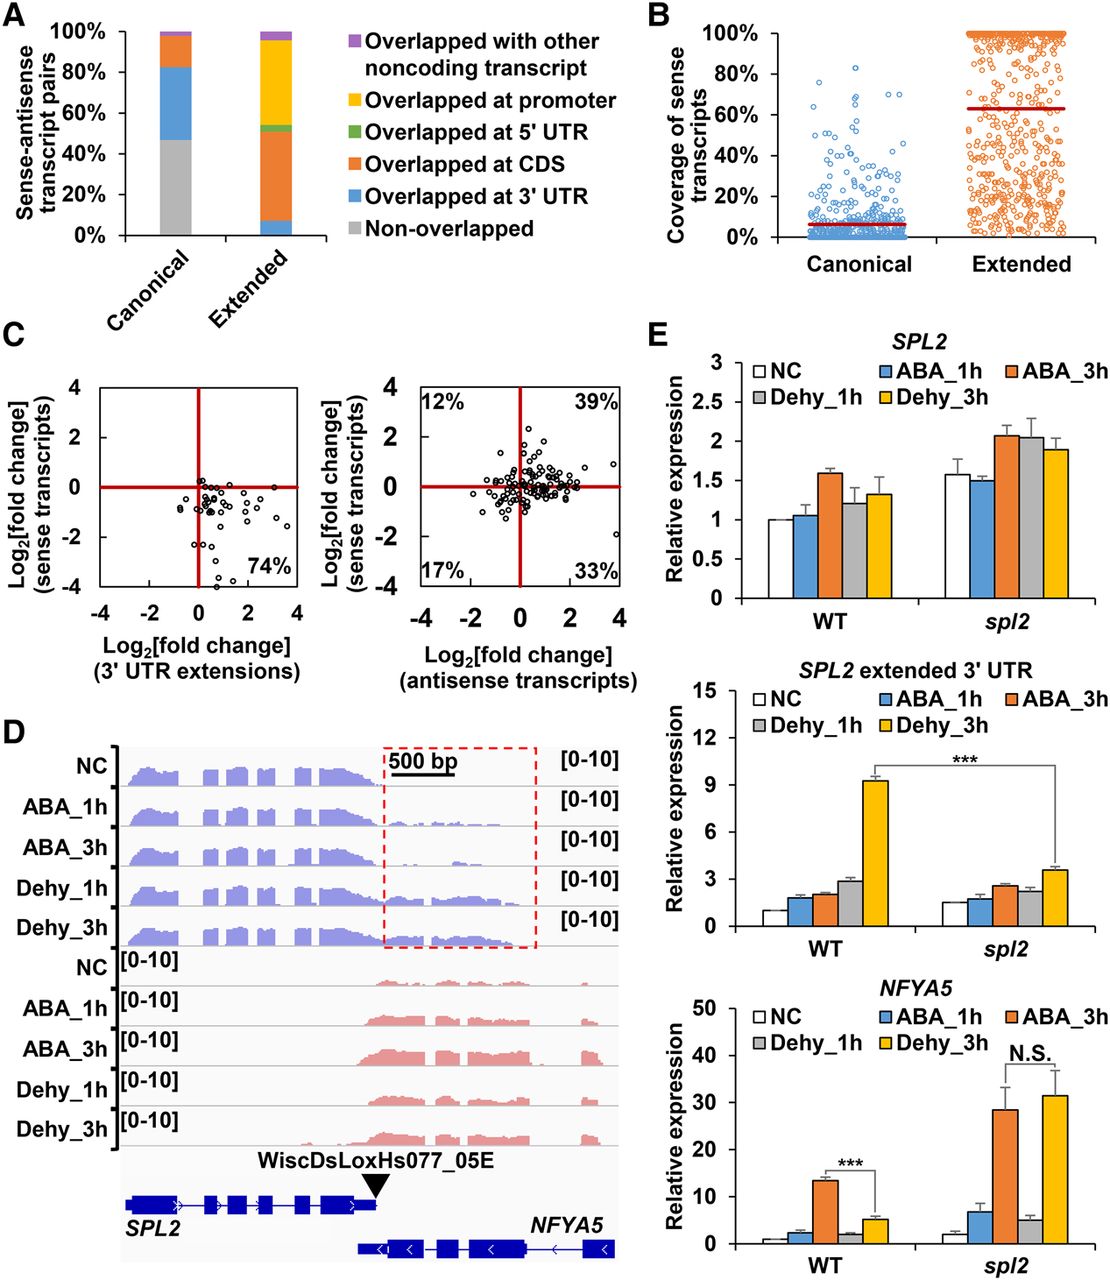
Repression of expression levels of sense genes by extended 3′ UTRs. (A) Composition of overlapping regions between sense and antisense transcripts. A total of 605 pairs between sense transcripts and antisense transcripts (canonical 3′ UTRs and extended 3′ UTRs) were used for the plot. (B) Coverage of sense transcripts overlapped by canonical 3′ UTRs and extended 3′ UTRs. Red line indicates the average of coverage. The coverage is defined as the length of the overlapping region divided by the length of the sense gene, ranging from 0% to 100%. (C) Fold change of expression levels (FPKM) of 3′ UTR extensions (left) or transcripts without 3′ UTR extensions (right) versus fold change of expression levels (relative to ABA treatment) of sense transcripts in Dehy_3h compared with Dehy_1h. Log2-transformed fold changes were used for this plot. (D) The IGV Genome Browser view showing SPL2 and NFYA5. Blue and pink colors represent read abundance of forward strand and reverse strand, respectively. Extended 3′ UTR is depicted by a red rectangle. T-DNA insertion site is indicated by a black inverted triangle. (E) Real-time PCR analysis of expression levels of SPL2 (top), SPL2 extended 3′ UTR (middle), and NFYA5 (bottom) in WT and spl2 mutant. Transcript levels were normalized to ACT2 expression. The expression level of each gene in WT plants grown in normal condition (NC) was set to 1. Data are shown as mean ± SD (n = 3) of one representative result of three independent biological replicates. Asterisks indicate statistically significant differences: (***) P < 0.001; t-test; (N.S.) not significant.


