
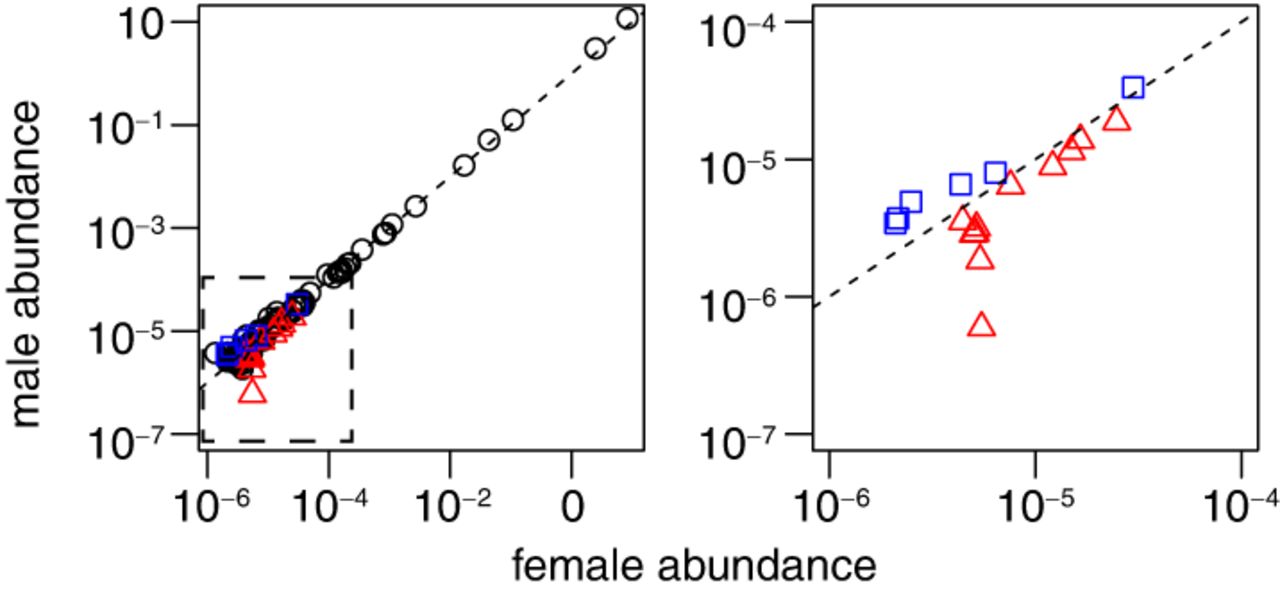
Minimal differences between k-mer abundances in male and female genomes. The left plot shows the abundances of the 100 most common k-mers in the male and female sequencing reads averaged across the three libraries from each sex in the aabys strain. The dashed box in the left graph indicates the subset of the range plotted on the right graph, which contains only k-mers in which abundances in all three libraries from one sex are greater than the three libraries from the other sex. Red triangles indicate k-mers in which abundances in all three female libraries are greater than the three male libraries; blue squares indicate k-mers that are more abundant in male libraries. The dashed line indicates equal representation in males and females.


