
Figure 4.
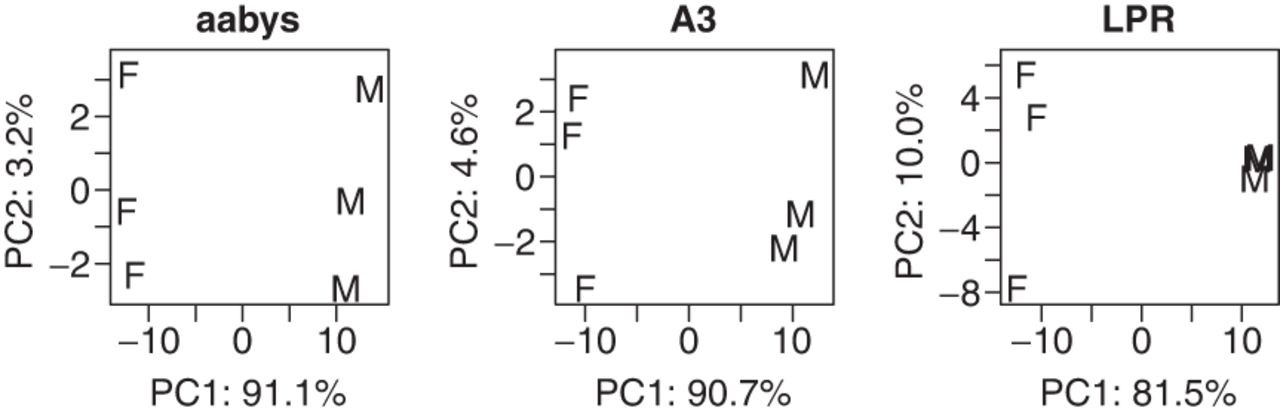
Plot of the first two principal components explaining differential sequencing coverage between female (F) and male (M) libraries.
(Downloading may take up to 30 seconds. If the slide opens in your browser, select File -> Save As to save it.)
Click on image to view larger version.
Plot of the first two principal components explaining differential sequencing coverage between female (F) and male (M) libraries.
 CiteULike
 Delicious
 Digg
Digg Facebook
 Google+
 Reddit
 Twitter
