
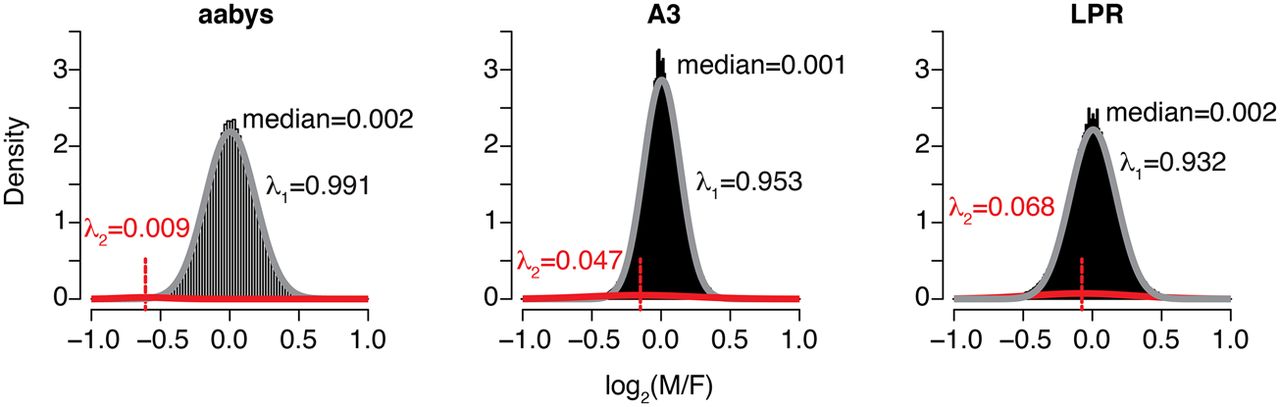
Figure 2.
Histograms are plotted of  for 1-kb intervals across three strains. The medians of the distributions are shown. The gray curve shows the normal distribution
that fits the majority of intervals (mean ≈ 0), and the red curve shows the normal distribution that fits the remaining scaffolds
(mean < 0). The λ1 values are the proportion of observed data estimated to be part of the gray normal distribution centered near zero, and λ2 is the proportion estimated to be part of the red distribution with a mean < 0. The red vertical lines show the means of
the λ2 distributions.
for 1-kb intervals across three strains. The medians of the distributions are shown. The gray curve shows the normal distribution
that fits the majority of intervals (mean ≈ 0), and the red curve shows the normal distribution that fits the remaining scaffolds
(mean < 0). The λ1 values are the proportion of observed data estimated to be part of the gray normal distribution centered near zero, and λ2 is the proportion estimated to be part of the red distribution with a mean < 0. The red vertical lines show the means of
the λ2 distributions.


