
Figure 1.
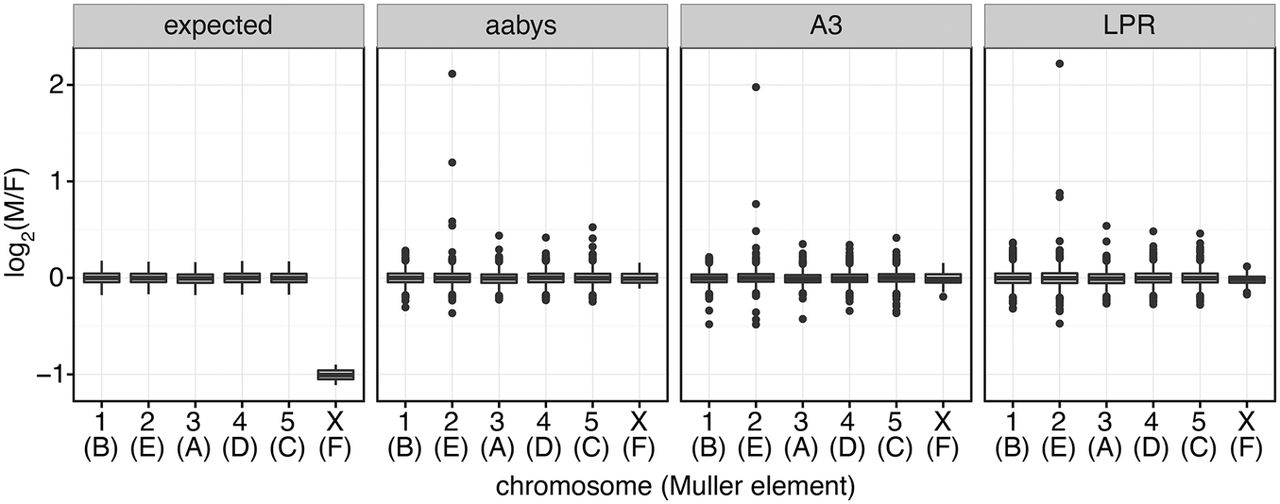
Expected sequencing coverage in males relative to females ( ) in an XY system with a degenerated Y Chromosome (left), and observed coverage in three house fly strains (aabys, A3, and LPR) for each house fly chromosome (Muller elements in
parentheses). Chromosome assignments are based on orthology relationships with Drosophila melanogaster. Box plots show the median and quartiles, with outliers indicated as points.
) in an XY system with a degenerated Y Chromosome (left), and observed coverage in three house fly strains (aabys, A3, and LPR) for each house fly chromosome (Muller elements in
parentheses). Chromosome assignments are based on orthology relationships with Drosophila melanogaster. Box plots show the median and quartiles, with outliers indicated as points.


