
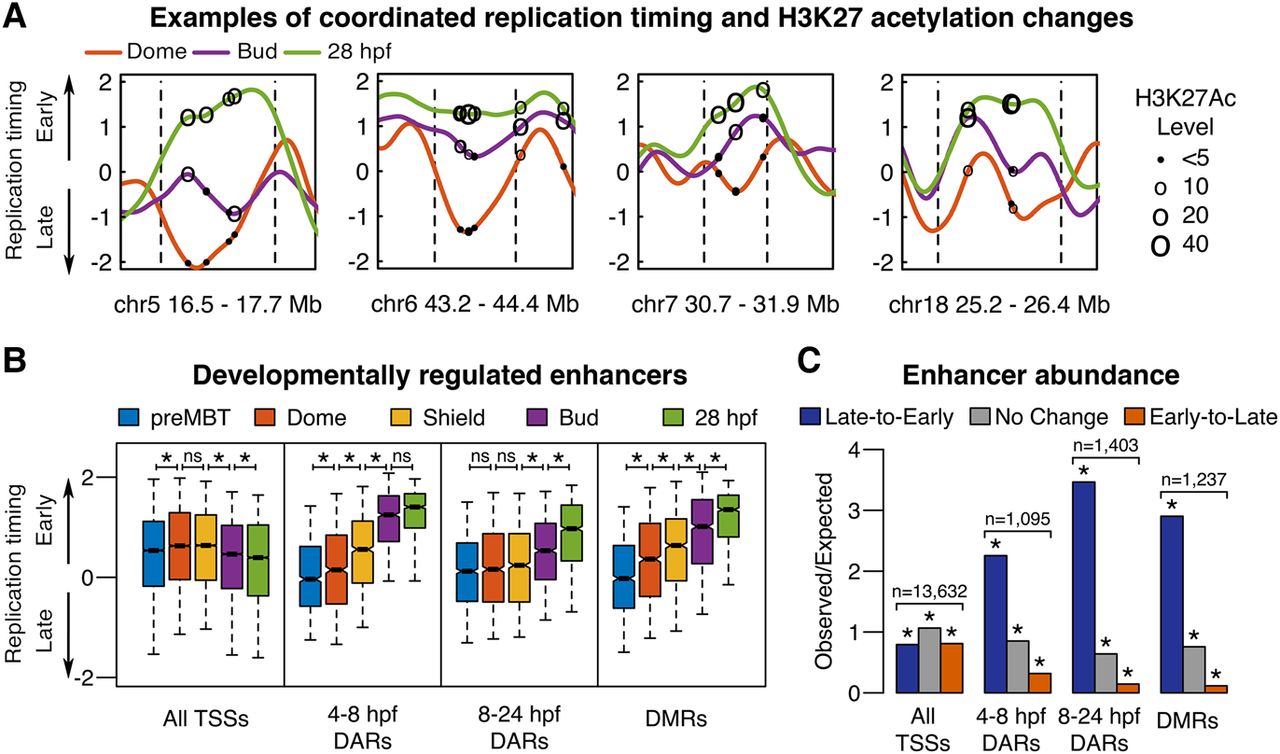
Enhancer activation parallels late-to-early replication timing changes during development. (A) Replication timing plots at Dome (4.3 hpf; orange), Bud (10 hpf; purple), and 28 hpf (green), with dashed lines indicating genomic region subject to developmental change. Circles mark the genomic positions of differentially acetylated regions (DARs) and have diameters proportionate to the acetylation levels at similar developmental stages (4.3 hpf, 8 hpf, and 24 hpf, respectively) (Bogdanović et al. 2012). (B) Replication timing at each developmental stage for the transcription start sites (TSSs), DARs that become acetylated between 4.3 and 8 hpf or 8 and 24 hpf, and differentially methylated regions (DMRs) that become demethylated between 6 and 24 hpf: (*) paired t-test with Bonferroni corrected P < 0.0001 (Bogdanović et al. 2012; Lee et al. 2015). Box plots show the median (line), 95% confidence interval (notch), 25th–75th percentile (box), and 10th–90th percentile (whiskers). (C) Observed/expected counts of TSSs, DARs, or DMRs in all genomic regions classified by hidden Markov model (HMM) segmentation as either undergoing developmental replication timing changes from late-to-early, early-to-late, or no change: (*) binomial test with Bonferroni corrected P-value <5 × 10⁻¹².


