
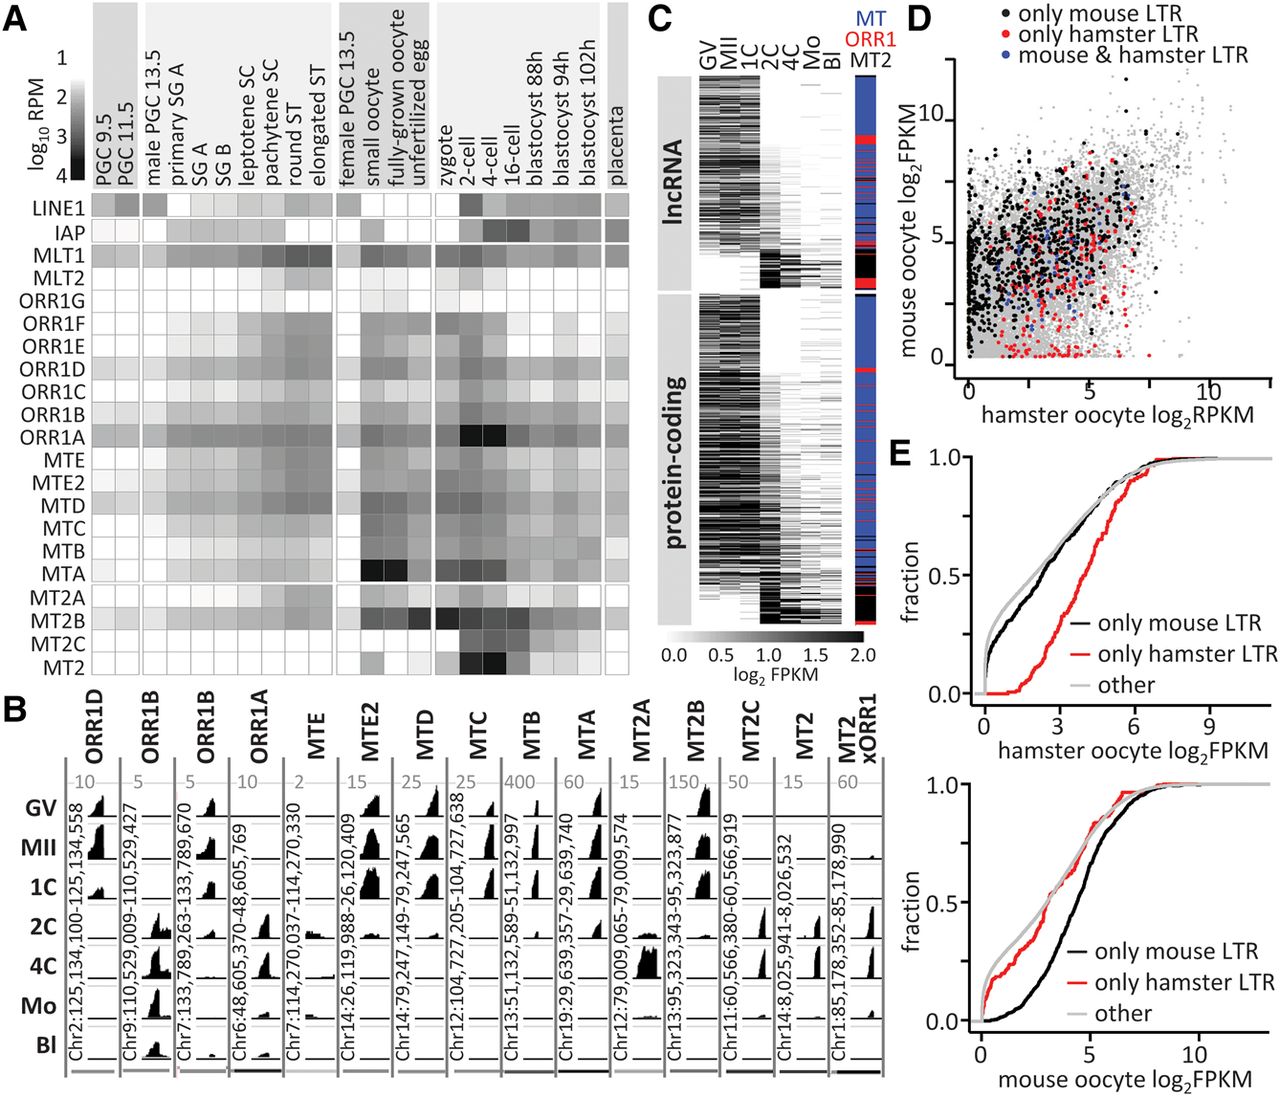
Transcriptional control by co-option of MaLR and MT2 LTRs. (A) LTR RNA abundance in transcriptomes of germline cycle stages presented as log10 RPM of selected LTR sequences in poly(A) NGS data sets (Supplemental Table S3). Included are profiles of LINE1 and IAP, the presently active mouse autonomous retrotransposons (Maksakova et al. 2006; Sookdeo et al. 2013). (B) Maternal and zygotic expression of solo LTRs during oocyte-to-embryo transition. UCSC Genome Browser (Kent et al. 2002) snapshots exemplify expression patterns of co-opted 5′ exons. For each LTR, all stages were set for the maximum CPM values indicated on the top of each column. Most LTR subfamilies have distinct maternal or zygotic expression patterns corresponding to the specific patterns shown here (Supplemental Fig. S3). At the same time, some variability within an LTR subfamily is occasionally observed as shown for two different ORR1B LTR insertions. Developmental stages: (GV) full-grown GV oocyte; (MII) metaphase II oocyte; (1C) one-cell (fertilized egg); (2C) two-cell; (4C) four-cell; (Mo) morula; (Bl) blastocyst. MT2xORR1 is the 3′ MT2 LTR of MuERV-L that is preceded by an 87-bp fragment of ORR1A3 internal sequence. (C) Expression of MaLR and MT2 LTR-derived 5′ exons from lncRNAs and protein-coding genes ordered by the maternal/ZGA expression ratio (GV+MII)/(2C+4C). The heatmap shows log2 FPKM values of the annotated LTR 5′ exons (full contribution) with FPKM >0.1 in at least one sample. The colored bar indicates the LTR family. (D) Expression of genes containing LTR-derived 5′ exons in mouse and hamster oocytes. Points represent log2 FPKM values of genes in mouse and hamster oocytes (GSE86470). Point colors indicate whether the 5′ LTR-derived exon is present in the mouse (black) or hamster (red) genome or in genomes of both species (blue), and gray points depict remaining genes. (E) Comparison of oocyte expression of genes that have an LTR-derived 5′ exon in mice or hamsters with expression of other genes. The x-axis represents gene expression (log2 FPKM), whereas the y-axis is fraction of genes.


