
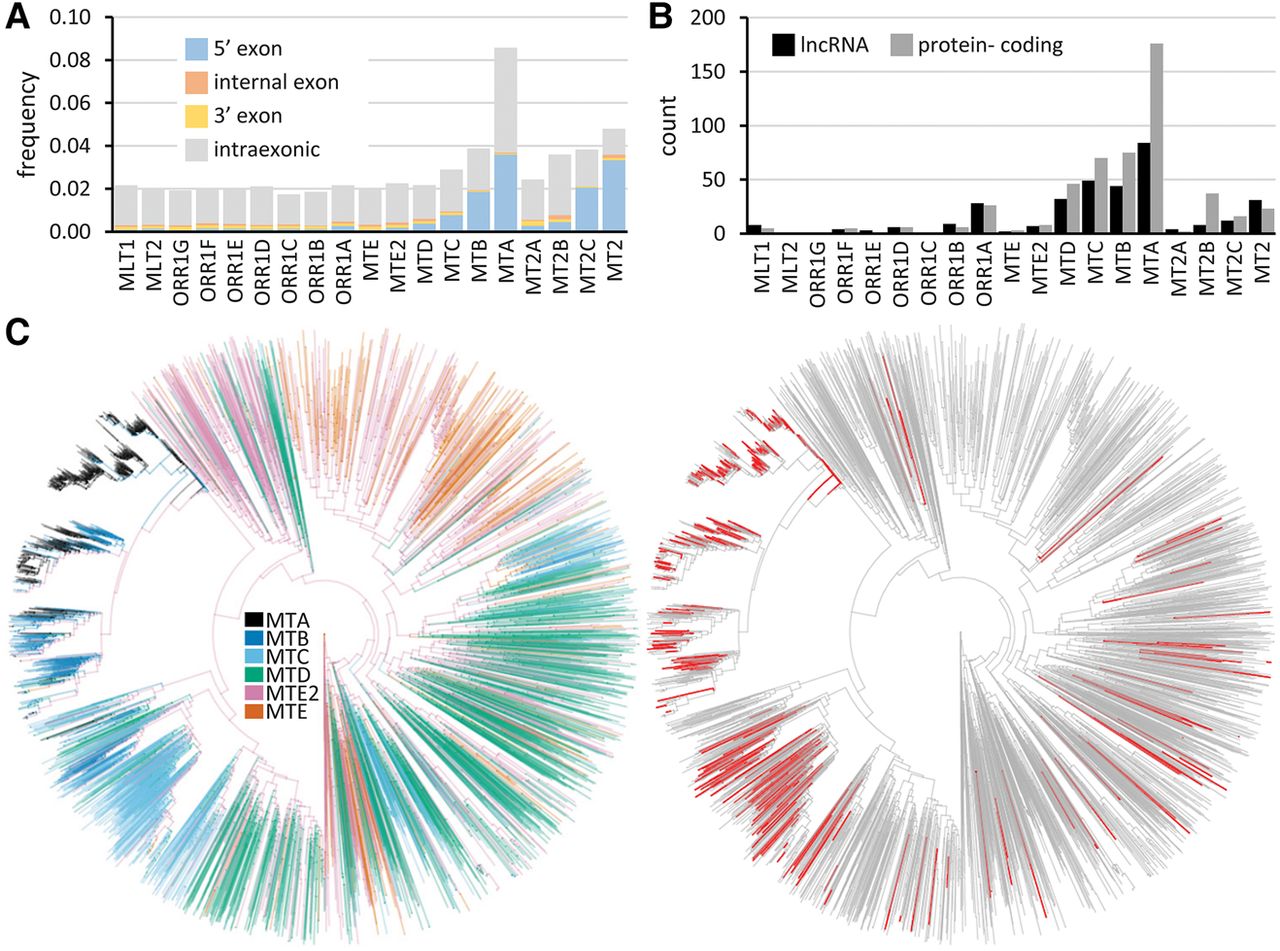
Figure 3.
Evolution of exon co-option in mice. (A) Frequency of co-options in selected LTR subfamilies (full and partial contribution). (B) Numbers of full LTR 5′ exon co-options in protein-coding genes and lncRNAs expressed in oocytes and early embryos. (C) MT LTR family phylogeny and bursts of gene rewiring events. The left tree shows a phylogenetic tree of 5000 randomly selected MT LTRs combined with 596 LTRs co-opted as complete 5′ exons. The right tree highlights in red the co-opted LTRs.


