
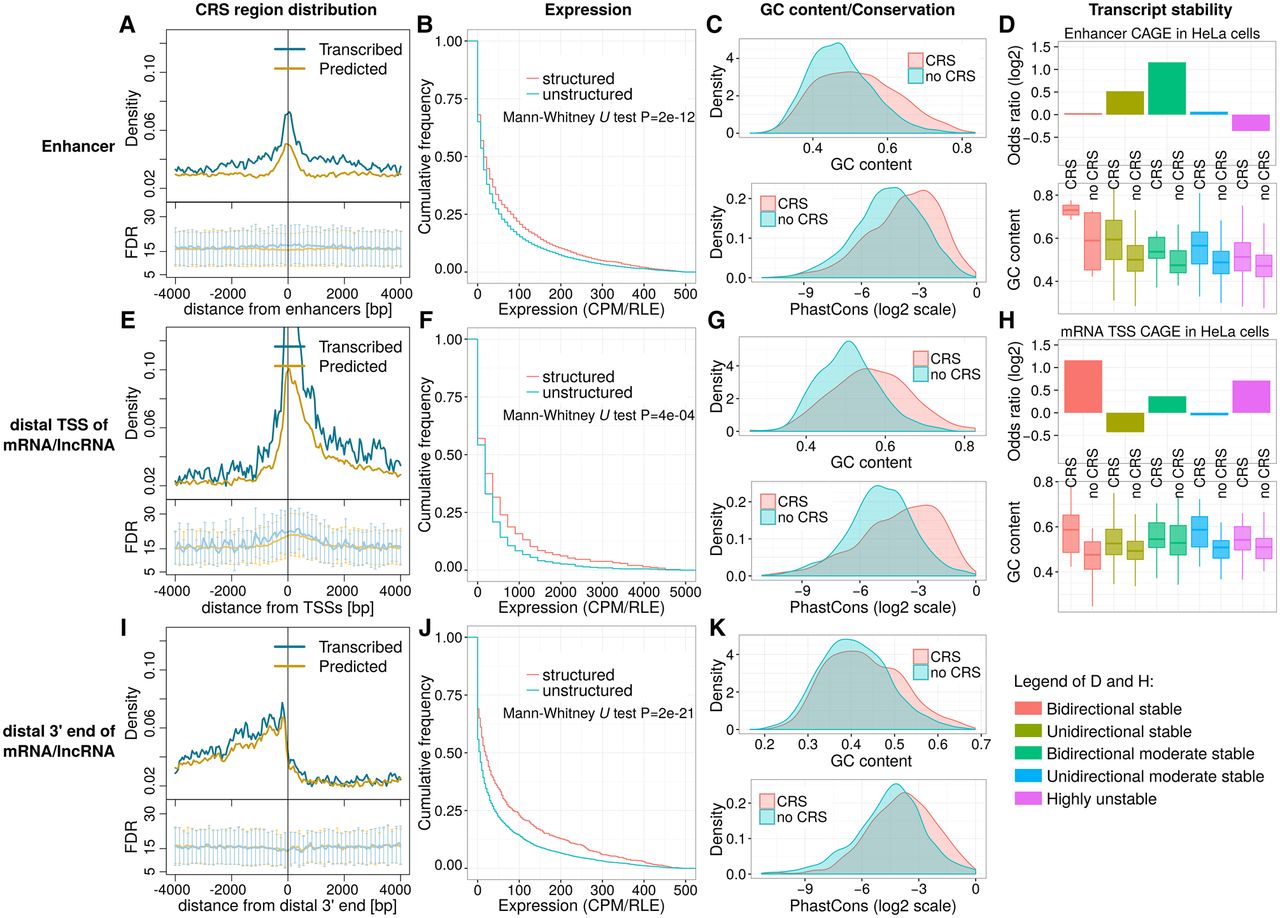
Coverage and expression of CRS regions in gene regulatory regions. The figure's three rows describe regions surrounding (1) enhancers (A–D), (2) most distal TSS of mRNAs/lncRNAs (E–H), and (3) most distal 3′ end of mRNAs/lncRNAs (I–K), respectively. (A,E,I) Plot density of CRS regions near those features: counts in 50-bp windows normalized by the number of features. “Predicted” curves (orange) reflect all CRS regions; “transcribed” curves (blue) reflect the subset supported by unannotated transcription boundaries. Lower subpanels show estimated FDRs (mean, SD) of those predictions. All other panels are based on the “transcribed” subset; for details, see Methods section “Definition of Gene Regulatory Regions” and Supplemental Figure S11. In summary, expression is based on the following: (B,C) CAGE TSS near enhancers, (F,G) CAGE TSS upstream anti-sense w.r.t. mRNA/lncRNA, and (J,K) active poly(A) sites downstream sense w.r.t. mRNA/lncRNA. “Structured”/“CRS” denote regions that overlap CRSs; “unstructured”/“no CRS” do not. (B,C,F,G) Total RNA-seq in fetal human cerebellum (technical replicate two of experiment ENCSR000AEW; ENCODE Phase 3). (J,K) Poly(A) RNA-seq of human brain (HBM). (B,F,J) Expression levels are in counts per million after cross-experiment relative log expression normalization (CPM/RLE). (C,G,K) GC content and phastCons (from 100-species MULTIZ alignments) of expressed structured (CRS) versus unstructured regions (no CRS). Expressed regions were defined by empirical P-value < 0.01 and CPM/RLE ≥ 1. (D,H) Transcript stability at ENCODE HeLa DHSs, as described in Andersson et al. (2014b), and GC content of structured (CRS) and unstructured regions (no CRS). Odds ratios quantify how strongly stability is associated with CRS overlap.


