
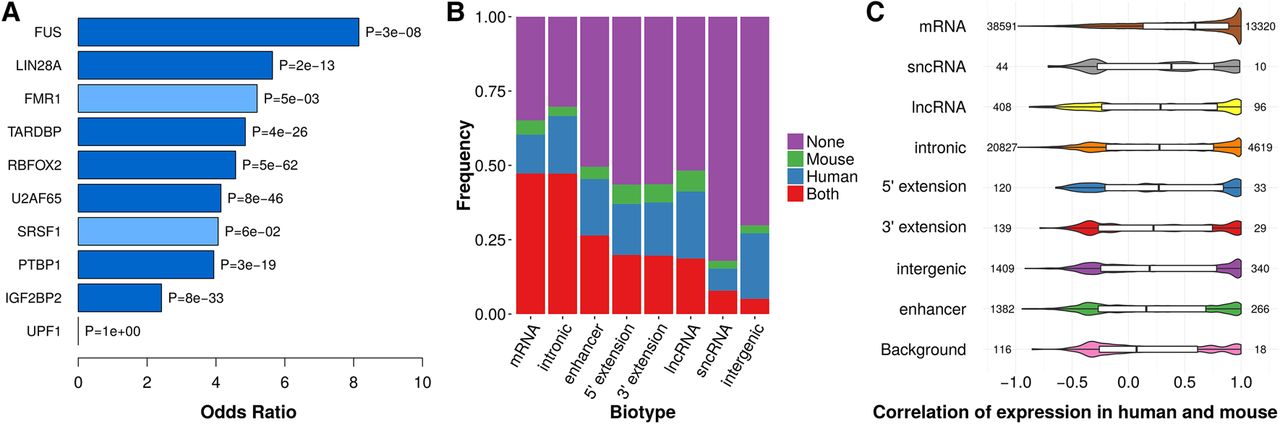
Human and mouse conservation of CRS regions is reflected by binding sites of RBPs and expression. (A) Seven of 10 RBPs display enrichment of CRSs in conserved binding sites (P < 10−7, FET). Significant enrichments are colored dark blue; light blue were not significant. (B) A relatively large number of CRSs (146,670) are expressed in both human and mouse (red bars) over four tissues (heart, liver, diencephalon/forebrain, and cerebellum/hindbrain) with comparable total RNA-seq data (Methods). In total, 157,136 CRSs are expressed in both human and mouse in total RNA-seq or poly(A) RNA-seq (Supplemental Fig. S7). CRSs with an empirical P-value < 0.01 were assigned an “expressed” state. We considered only 433,327 of 543,390 human–mouse conserved CRSs that have the same biotype in both species. Note that “5′ extension” and “3′ extension” refer to 2-kb regions upstream of and downstream from UTRs and lncRNAs; UTRs themselves are included in “mRNA.” (C) Expression correlation between human and mouse for different biotypes was measured by Pearson's correlation coefficient r of expression levels in poly(A) RNA-seq (six tissues: testis, liver, kidney, heart, cerebellum, and brain). “Background” is sampled over the input MA blocks with human–mouse conservation not overlapping the other biotypes. The number on the left of violin plots is total number of measured CRSs with expression in at least two tissues, and the number on the right side is number of CRSs with r > 0.8.


