
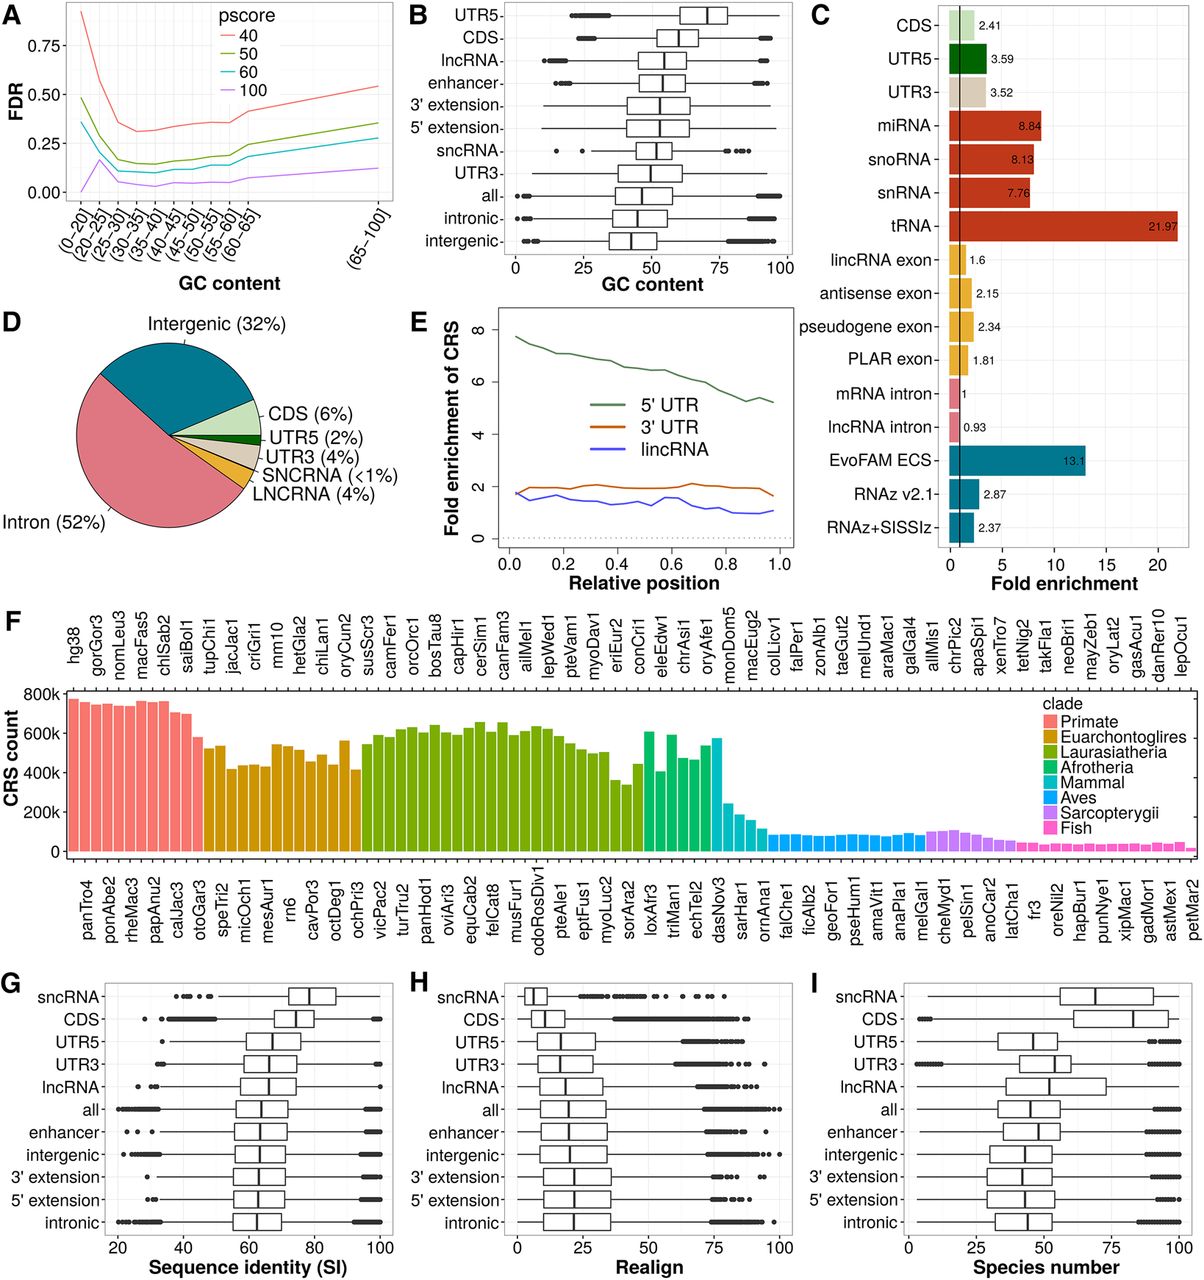
Performance assessment, genomic distribution, and conservation of CRS predictions. (A) Mean FDR of CRSs for different CMfinder score (pscore) cutoffs and GC-content intervals. FDR calculation is based on SISSIz (Gesell and Washietl 2008) simulated alignments. The large decrease in FDR observed between pscore cutoff 40 and 50 motivated us to base all further analyses on pscore ≥ 50. The mean FDR covering all ranges of GC content is 15.8. (B) GC content of CRS region alignments. (C) Fold enrichment of CRS regions for biotypes and previous computational RNA structure screens in vertebrates (blue). (D) Absolute CRS region coverage of biotypes. (E) Relative position of CRS regions over noncoding biotypes presented as fold enrichment of CRS regions in bins, each 5% (considering only exons) of the feature's (UTR or gene) length. The trend of decreasing number of structures from 5′ to 3′ is common to 5′ UTRs and lncRNAs. (F) Number of CRSs conserved in the 100-species tree. (G) Average pairwise sequence identity (SI) of CRS region alignments over the 17 representative genomes in the phylogenetic tree. (H) Realignment (calculated as in Torarinsson et al. 2008) compares the 17-species MULTIZ alignment blocks (hg18) to corresponding structure-based alignments of CRS regions (17-way subalignments extracted from our 100-species/hg38 results, as described in Methods). (I) Species number of CRS region alignments. In B,G, and I, the CRSs of highest GC content, SI and species number, respectively, are used as representatives of a CRS region, and in H the CRSs of lowest realignment are used as representatives. The biotypes in G, H, and I are sorted by their median SI.


