
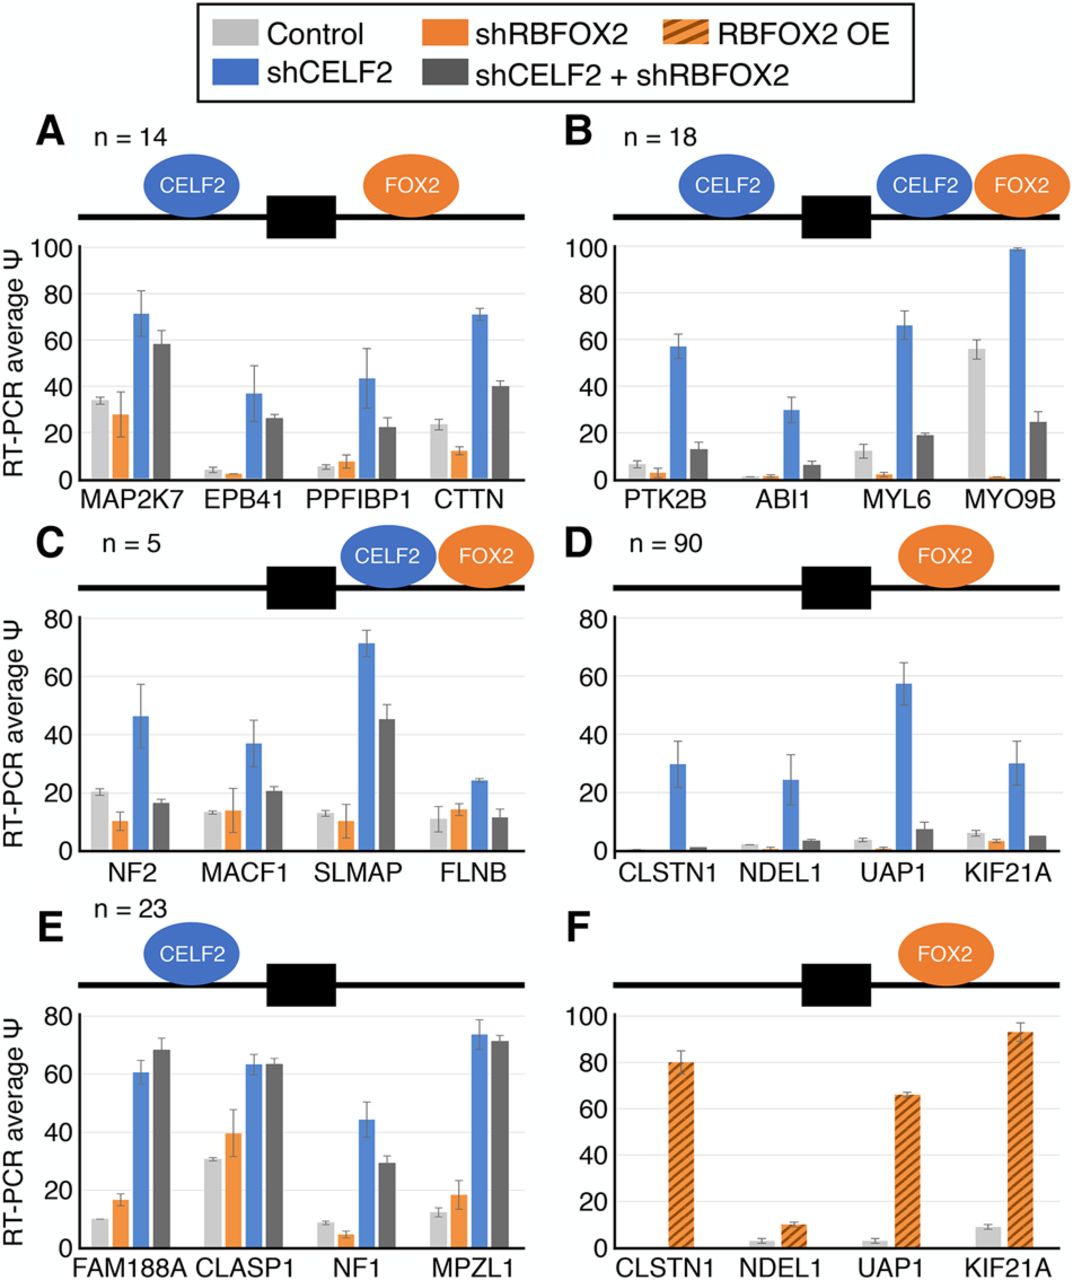
Reciprocal regulation of CELF2-repressed exons by RBFOX2 in T cells. (A–E) Quantification of splicing by RT-PCR (see Supplemental Fig. S1 for gels) of MAJIQ-identified CELF2-repressed exons that contain proximal intronic binding of CELF2 (CLIP peak) and/or RBFOX2 (CLIP peak and/or GCAUG) in wild-type Jurkat T cells (light gray), or cells depleted of RBFOX2 (orange), CELF2 (blue), or both proteins (dark gray) by shRNA. Efficient depletion of proteins was confirmed via Western blot (see Fig. 4). Mean and standard deviation (error bars) are shown (n ≥ 3). Diagrams above bar charts indicate binding locations of CELF2 and/or RBFOX2 upstream or downstream of the alternative exon. n represents the number of cassette exons exhibiting that binding pattern. Data shown are from stimulated cells; data for unstimulated cells are provided in Supplemental Figure S2. (F) Quantification of splicing by RT-PCR in wild-type Jurkat T cells (light gray) or those overexpressing RBFOX2 cDNA (orange stripe). Protein expression and RT-PCR gels are in Supplemental Figure S3.


