
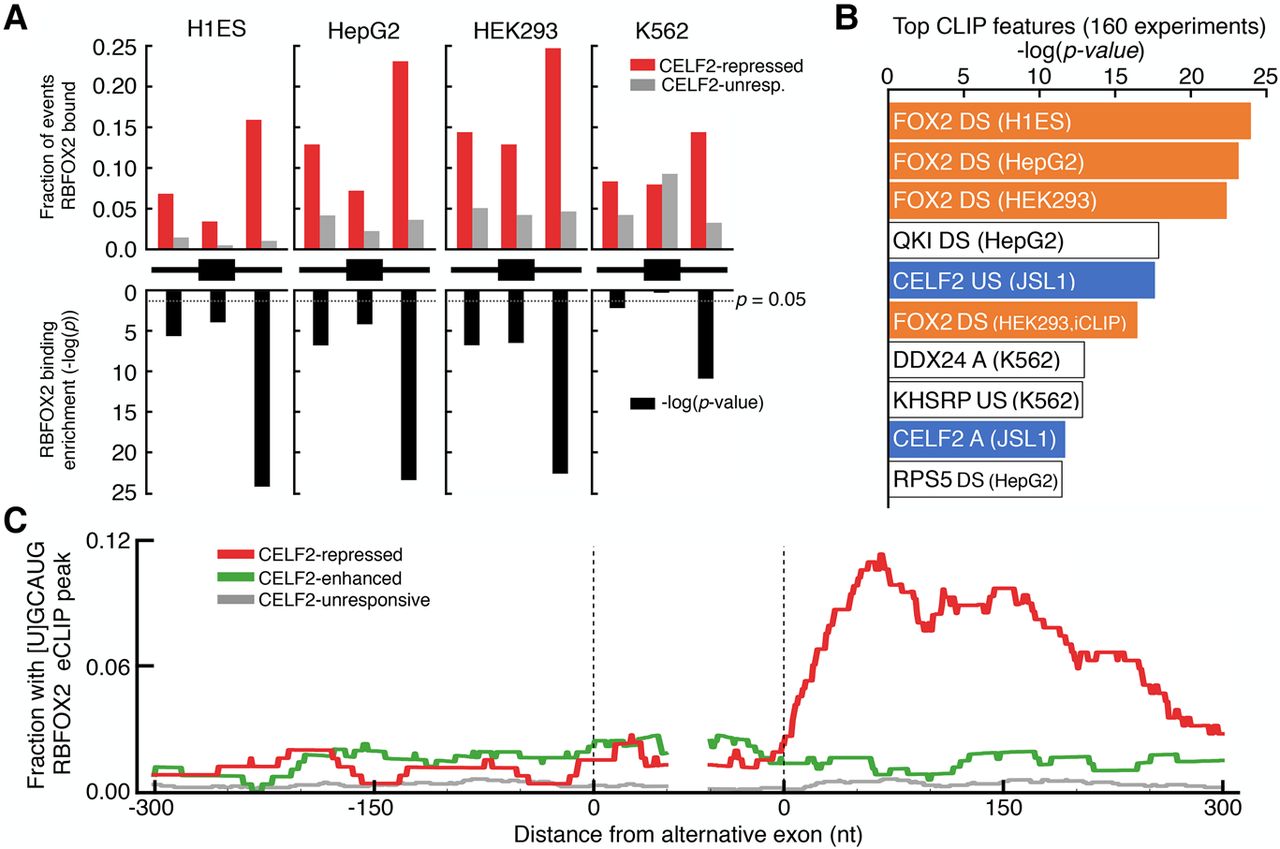
CELF2-repressed exons are highly enriched for downstream in vivo binding of RBFOX2. (A) Fraction of exons that were repressed by CELF2 (red) or unresponsive (gray) that contained an RBFOX2 eCLIP peak from indicated cell type in regions proximal to the alternative exon (black diagram: within 300 nt upstream, within the exon, or within 300 nt downstream) (top) and −log10(P-value) of enrichment of RBFOX2 eCLIP peak occurrence in the CELF2-repressed versus unresponsive set (bottom, black bars, Fisher's exact test, two-tailed P). (B) Top 10 enriched CLIP features found when comparing CLIP peak occurrence from 160 experiments (ENCODE eCLIP and iCLIP) (Ajith et al. 2016) between CELF2-repressed and unresponsive exons. Condition in which each CLIP experiment was carried out is indicated in parentheses. CLIP experiments for RBFOX2 or CELF2 are indicated in orange or blue, respectively. (DS) Bound downstream of alternative exon, (US) bound upstream of alternative exon, (A) bound within alternative exon. (C) RNA maps showing the per-nucleotide frequency of [U]GCAUG containing RBFOX2 eCLIP peak occurrences within 300 nt of alternative exons that are repressed by CELF2 (red), enhanced by CELF2 (green), or were unresponsive to depletion (gray).


