
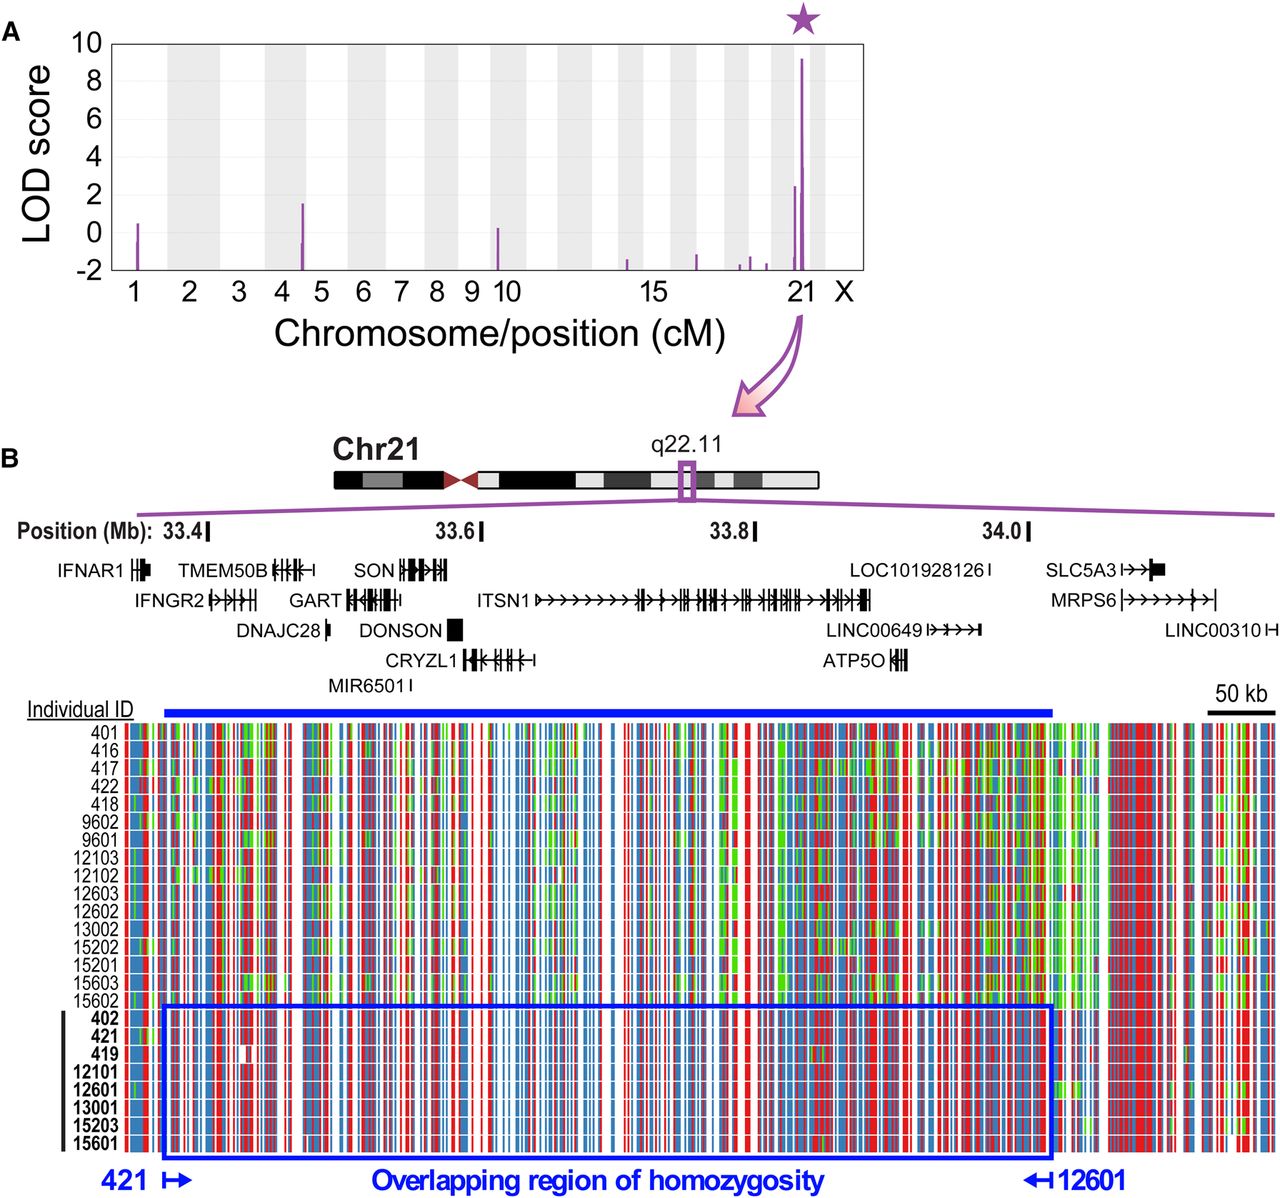
Linkage and homozygosity analysis identifies a locus on Chromosome 21q22.11. (A) Linkage analysis using SNP-microarray genotypes of affected individuals and unaffected parents (see Supplemental Data 1 for list of genotyped individuals) identified a locus associated with the disease at Chromosome 21q22.11 with maximum LOD score of 9.2 (purple star; interval: Chr 21: 33,344,469–34,196,070; GRCh38/hg38). (B) SNP-microarray genotypes in the interval defined by linkage analysis (Fig. 2A). Each line represents an individual (unaffected parents on top and affected individuals labeled in bold on bottom). Each column in the SNP ideogram represents a SNP, with homozygous alleles in red or blue and heterozygous alleles in green. Affected individuals 421 and 12601 define a minimal region of overlapping homozygosity (ROH) at 21q22.11 (blue box and line; Chr 21: 33,364,965–34,029,433; GRCh38/hg38). RefSeq gene annotations are shown above. Low quality SNP calls are omitted. Note: samples 418 and 419 are shown here but these were not used for linkage analysis since they did not pass quality control filters (see Supplemental Methods).


