
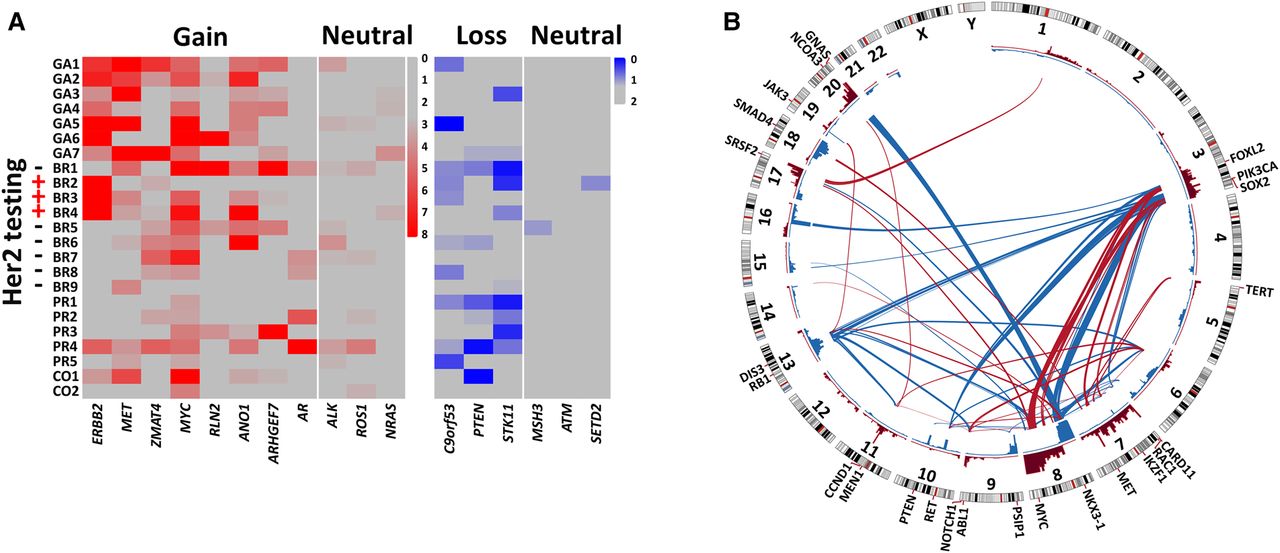
Integrative analyses of the CNA patterns of CTCs from patients with different types of cancer. (A) Eleven genes with recurrent CNAs (red, gains; blue, losses) across breast, gastric, prostate, and colon cancer. HER2 (ERBB2) protein levels were assessed by immunohistochemical staining. As a control (neutral), the copy numbers of a few well-known oncogenes and tumor suppressor genes were also assessed. (B) Correlation analyses of significant gain or loss regions in patients with breast, gastric, prostate, and colon cancer. The red and blue bars in the inner circle denote significant gains and losses, respectively. The red and blue lines across the circle represent concurrent and mutually exclusive CNAs, respectively.


