
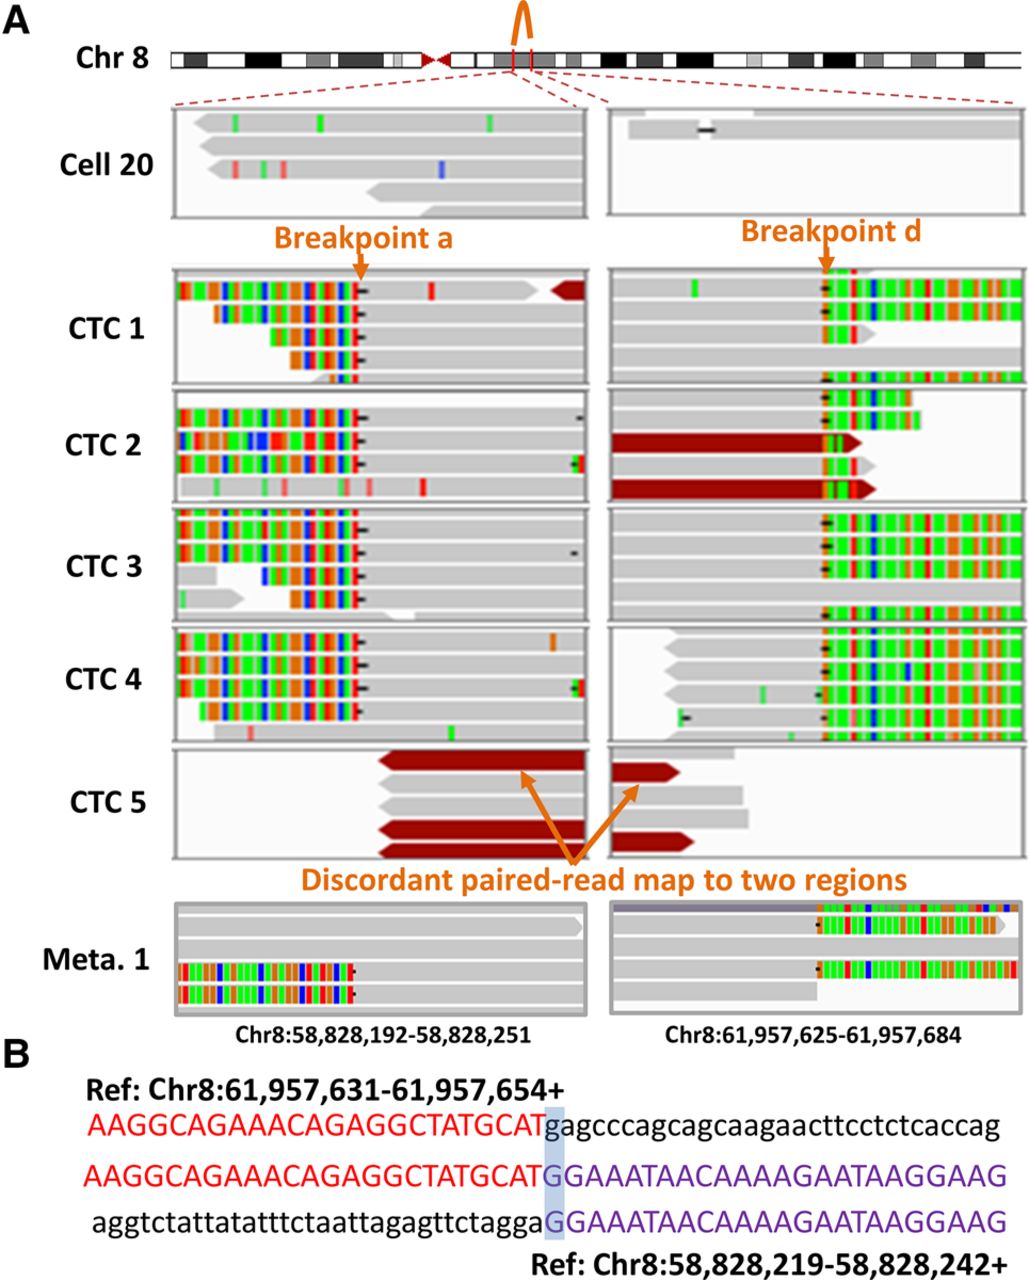
Identification of breakpoint sequences at the CNA boundaries. (A) Visualization of aligned reads around breakpoints a and d at the CNA boundaries in a primary tumor cell (Cell 20), five CTCs, and one of the lymph node metastases (Meta. 1) using an Integrative Genomics Viewer (IGV). Alignments are represented as gray, with color-coded base mismatches (A, green; T, red; G, orange; C, blue). Soft-clipped (colorful) bases around one breakpoint can be mapped to the reference genome around another joined breakpoint. Read pairs mapped to chromosome regions with much larger separations than the estimated insert size are indicated in dark red. (B) Sequences at the junction of breakpoints a and d. A representative sequence read (middle) was mapped to two regions (above and below) in the reference genome with appropriate orientation (+, forward strand).


