
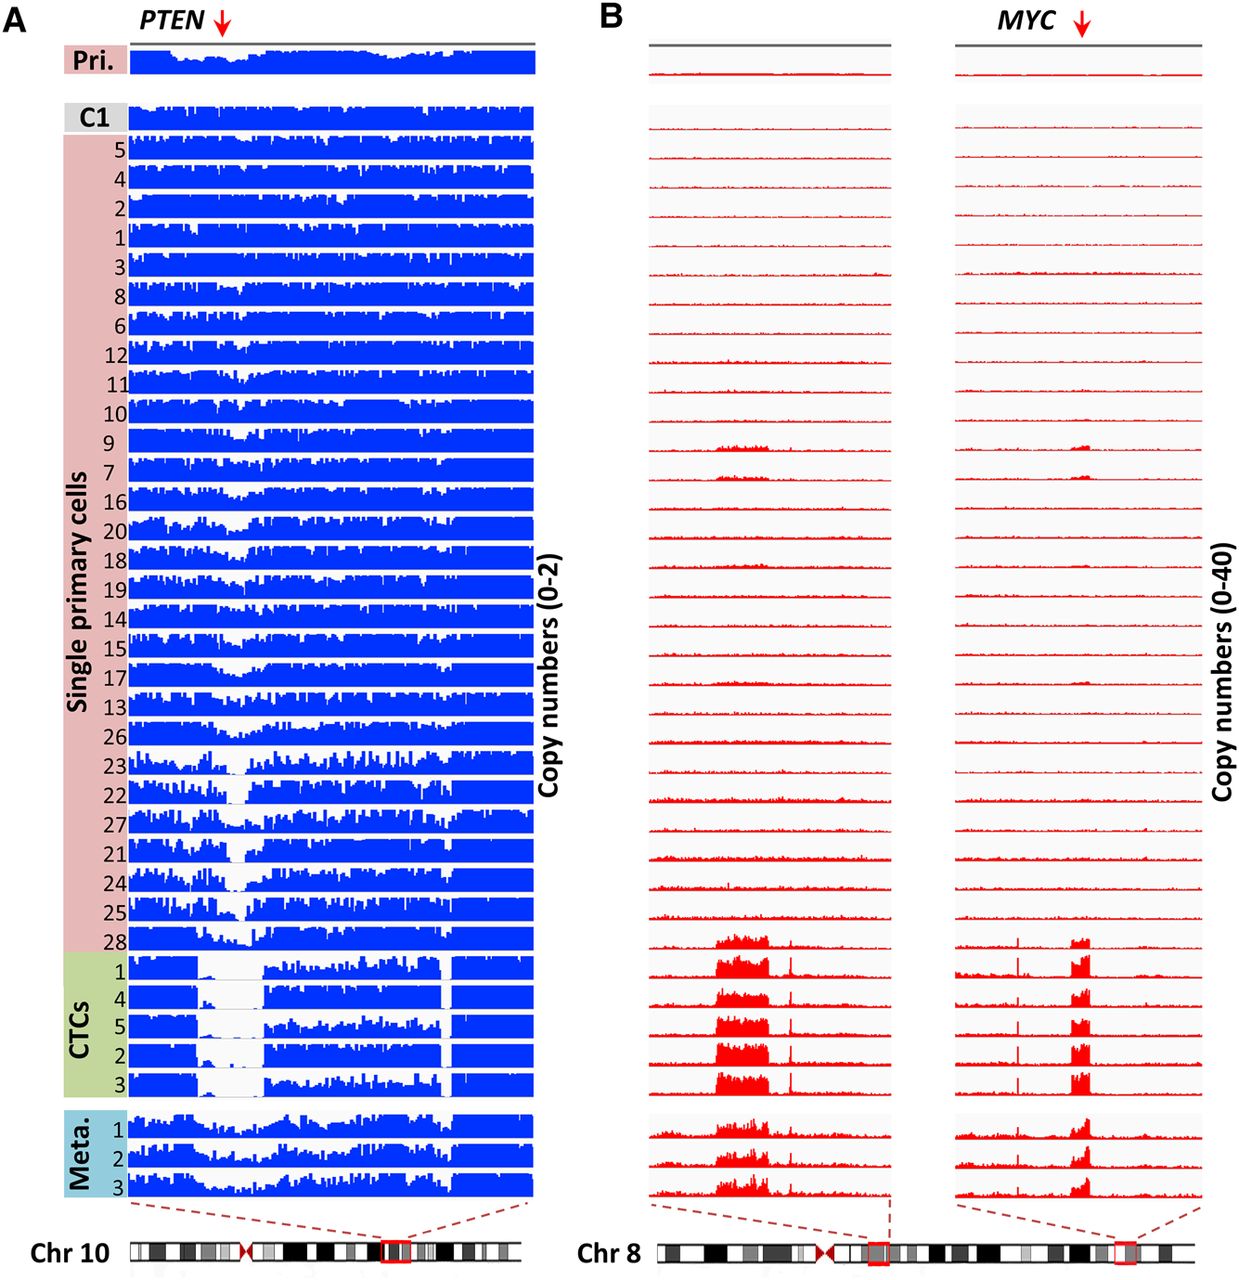
Figure 2.
Evolution of focal CNAs in primary tumor cells and CTCs. (A) Visualization of aligned reads around a focal region of Chromosome 10 (Chr 10: 86,880,000–98,090,000) containing the PTEN gene. The bin size was 50 kb. The maximal ordinate coordinate values were set to reads corresponding to a copy number of 2. (B) Visualization of aligned reads around multiple focal regions of Chromosome 8 (Chr 8: 56,000,000–66,160,000; Chr 8: 123,850,000–133,210,000) containing the MYC gene. The bin size was 50 kb. The maximal ordinate coordinate values were set to reads corresponding to a copy number of 40.


