
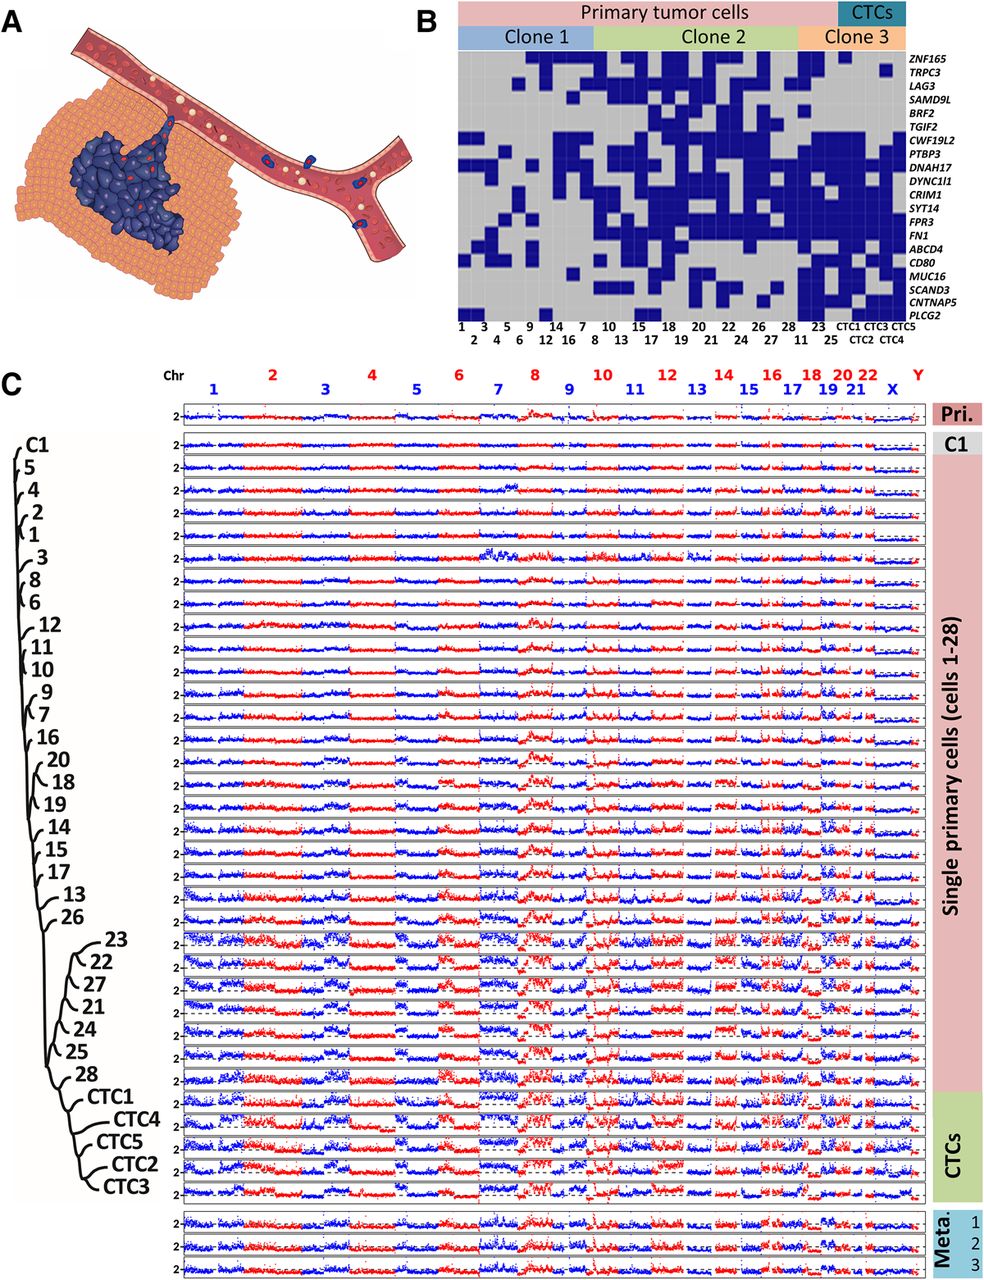
Evolution of SNVs and large-scale CNAs in primary tumor cells and CTCs. (A) Schematic diagram of the manner in which primary tumor cells intravasate and become CTCs. (B) SNV loci of primary tumor cells and CTCs. The distribution of 20 nonsynonymous mutations was assessed in 28 primary tumor cells (Cells 1–28) and five CTCs (CTCs 1–5) from a colon cancer patient (blue box, mutant; gray box, wild type). Three clones of cells were present according to a probabilistic modeling-based approach. (C) CNA patterns of the primary tumor, one control leukocyte (C1), single primary tumor cells, CTCs, and three lymph node metastases. (Pri.) Primary tumor, (Meta.) metastases. The copy numbers (blue and red dots) are plotted along the genome at a bin size of 500 kb. The ordinate coordinate represents copy numbers ranging from 0 to 6 (a copy number of >6 copies is set to 6). Phylogenetic tree on the left was constructed based on the segmented copy numbers of single cells.


