
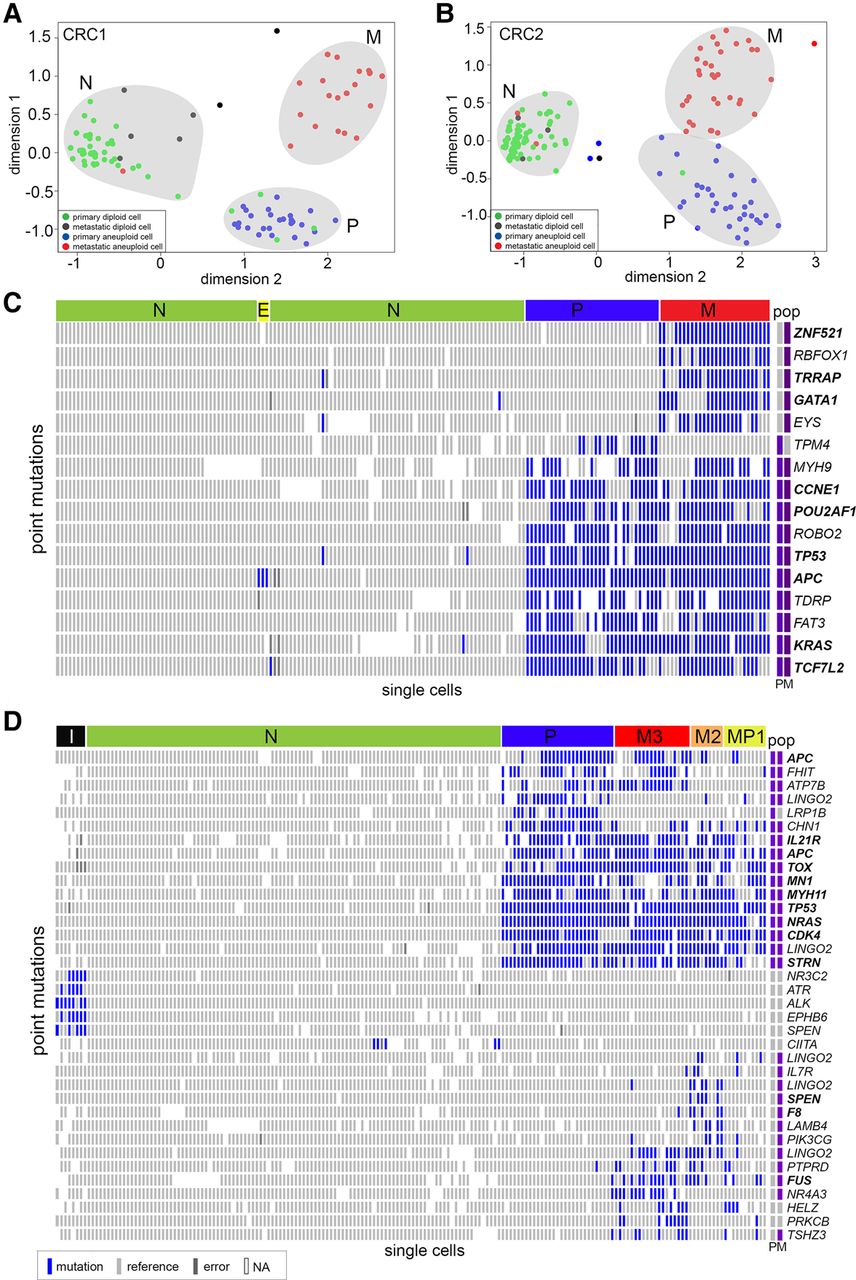
Single-cell mutational profiling of matched primary and metastatic tumors. Targeted cancer gene panel (T1000) sequencing data of point mutations in 372 single cells from the primary colon and liver metastatic tumors from patients CRC1 and CRC2. (A,B) Multidimensional scaling analysis, in which each dot represents a single cell. Cells are colored by the flow-sorting distribution from which they were isolated. (C,D) Two-dimensional clustered heat maps of the single-cell mutation data (T1000), with clusters labeled by color above. Nonsynonymous mutations are labeled in bold, while synonymous mutations are labeled in regular text. Populations of flow-sorted aneuploid tumor cells that were sequenced on the T1000 panel from the primary and metastatic tumors are shown on the right-hand side and labeled as “pop.” Blue bars represent mutations, light gray bars represent reference alleles, dark gray bars represent false-positives, and white bars represent sites with low or no coverage (NA).


