
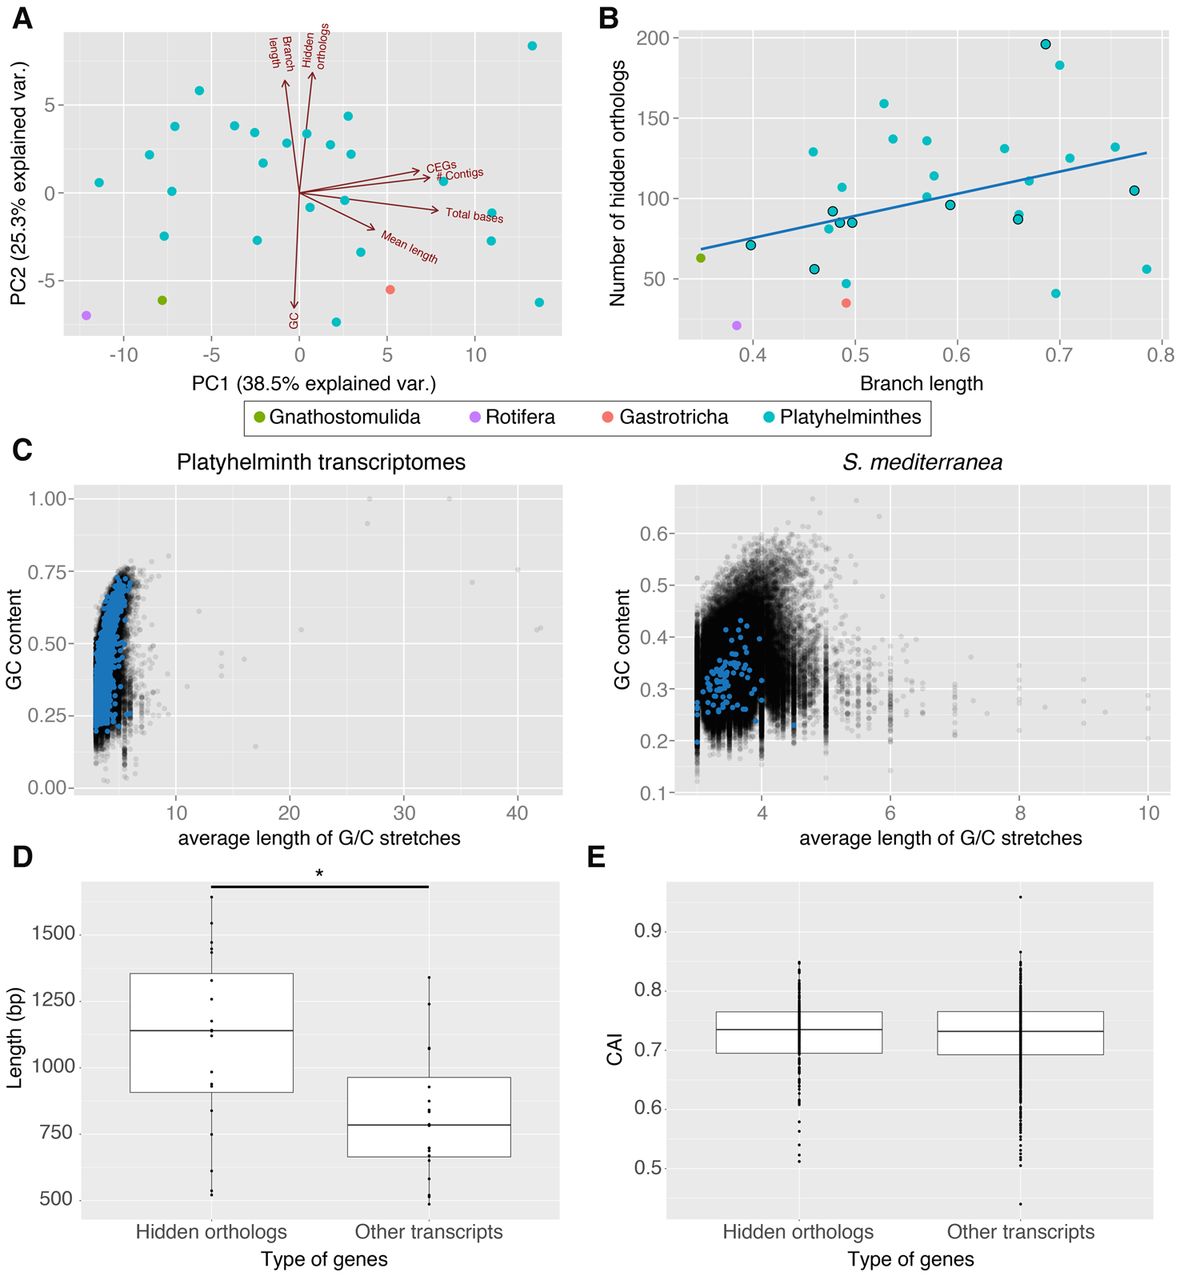
Hidden orthologs, evolutionary rates, and sequence composition analyses. (A) Principal component analysis of the analyzed data showing the eigenvectors for each variable. The first two principal components (PC1, PC2) explain together 67.6% of the observed variability. (B) Number of hidden orthologs in relation to the branch length of each lineage (linear regression in blue; dots with external black line indicate the taxa with highly complete transcriptomes). There is a low correlation between the two variables (R2= 0.124). (C) GC content of each transcript plotted against its average length of G/C stretches considering all studied flatworm transcriptomes (left) and only S. mediterranea (right). The transcripts corresponding to hidden orthologs are in blue. Hidden orthologs do not differentiate from the majority of transcripts. (D) Average length of hidden orthologs compared to the average length of the other genes in transcriptomes with ≥85% CEGs. Hidden orthologs are significantly longer than the rest (Mann-Whitney U test; P < 0.05). (E) Codon adaptation index (CAI) of the hidden orthologs of the planarian species B. candida, D. tigrina, and S. mediterranea compared with nonhidden orthologs. CAI index in hidden orthologs does not significantly differ from the rest of transcripts (Mann-Whitney U test; P < 0.05).


