
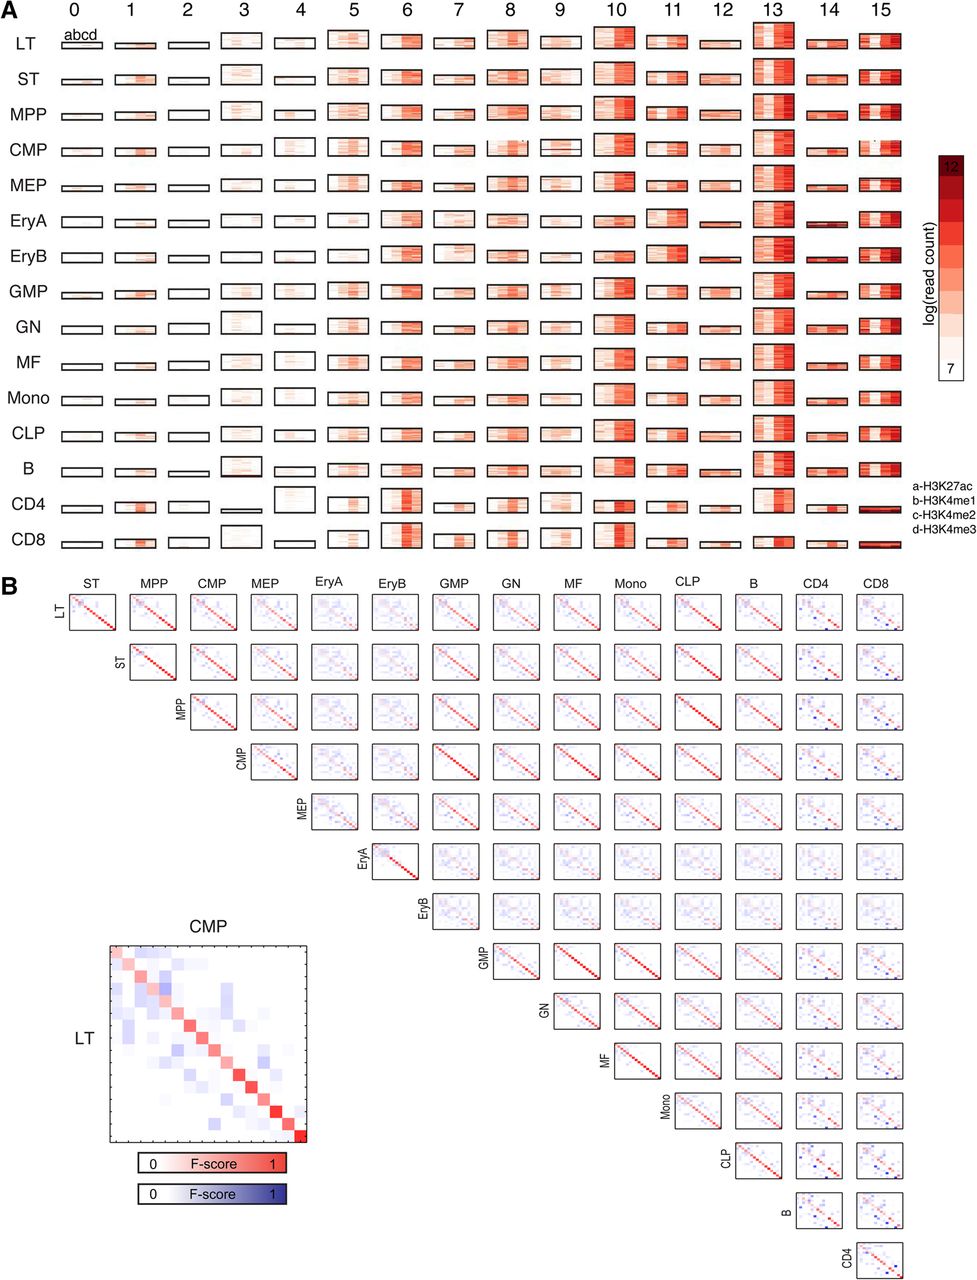
CMINT modules identified on the hematopoiesis cell lineage when applied to a subset of regions containing measurements for all histone modifications. (A) Heatmaps of 16 chromatin modules numbered from 0 to 15, obtained from CMINT restricted to 2000-bp regions with a non-zero value for each of the four histone modifications. Each row in each heatmap represents one region; each column represents one histone modification: (red) enriched; (white) depleted. The height of each module is roughly proportional to the number of regions within it. (B) Plot of similarity of module membership of regions, in which similarity was measured based on F-score, between each pair of cell types. Two different scales are used: (red) similarity for modules with similar patterns (diagonal entries); (blue) similarity for modules with different patterns (off-diagonal entries). The more red or blue an entry, the more similar are the matrices.


