
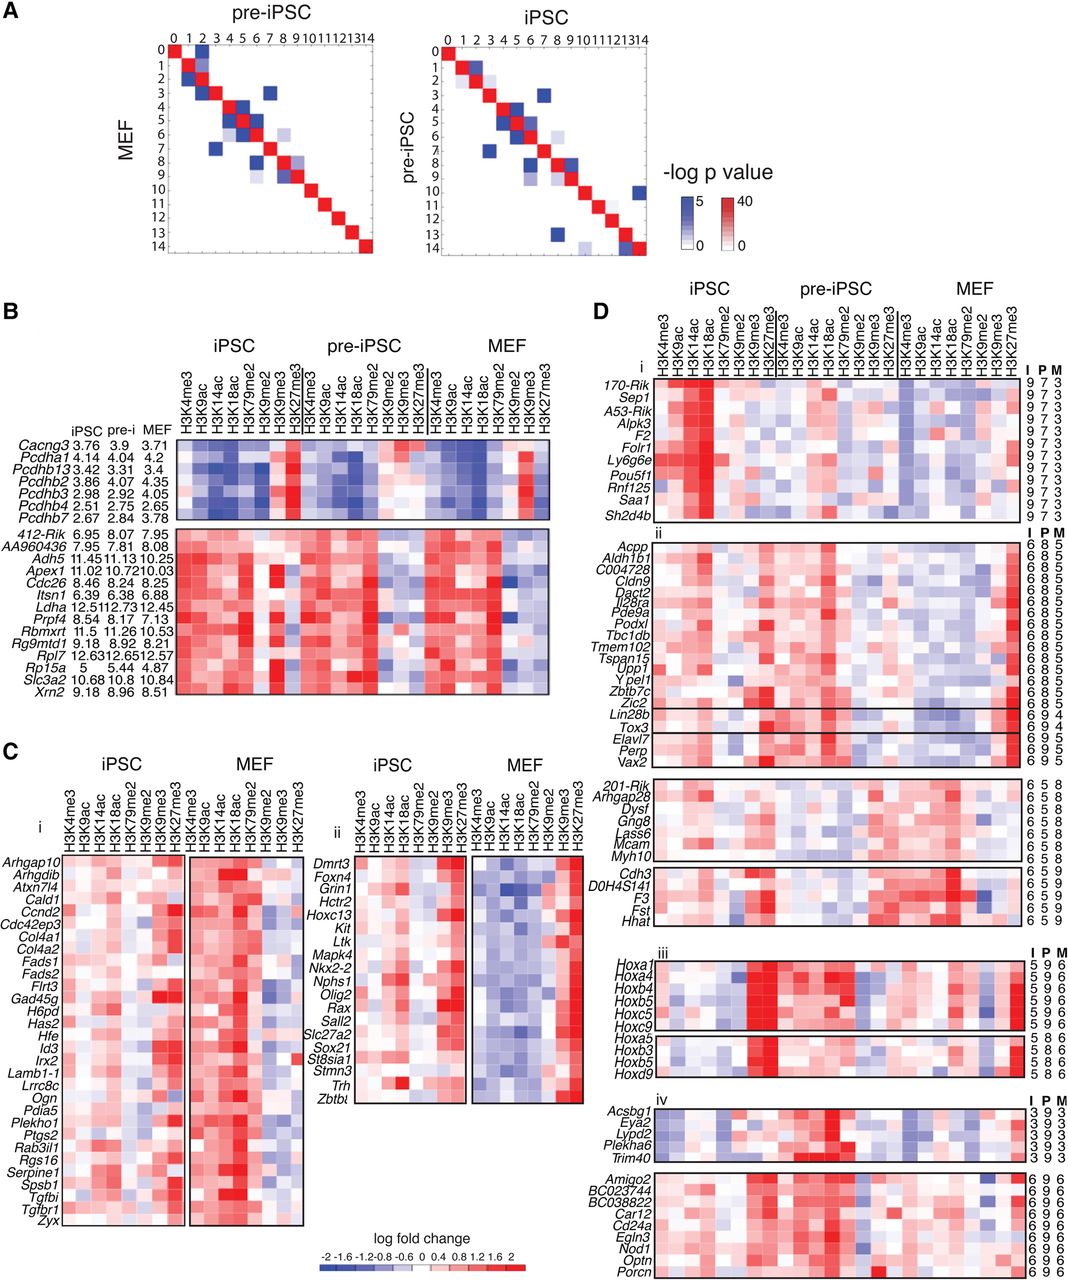
Chromatin module transitions during reprogramming. (A) Plot of similarity of module membership of genes that change between MEFs and pre-iPSCs (left), and pre-iPSCs and iPSCs (right). Two different colors are used: (red) denotes similarity for modules with the same pattern (diagonal entries); (blue) denotes similarity for modules with different patterns (off-diagonal entries). The more red or blue an entry, the more similar are the matrices. The intensity of red (blue) corresponds to the significance of overlap of regions (genes) between two cell types and is the mean of the negative log of two hypergeometric test P-values. One P-value uses regions from one cell type as the background, and another P-value uses the regions from the second cell type as the background. (B) Example sets of genes that do not change greatly in expression but change in module membership. (Left) Gene names and log gene expression in iPSC, pre-iPSC (pre-i) and MEF. (Right) Heat map of enrichment of all histone modifications in iPSC, pre-iPSC and MEF compared to input. (Red) enriched; (blue) depleted. (412-Rik) 4121402D02Rik. (C) Left and right panels represent different gene sets, each exhibiting a different type of chromatin transition. (Left) Example set of genes that gain multivalency in iPSCs from an active state in MEF. (Right) Example set of genes that gain multivalency in iPSCs from a repressed state in MEF. Gene names are provided on the left. The heat maps show the enrichment of histone marks compared to input in each cell type. (D) Chromatin module dynamics of genes identified using rules encoding patterns. The right panels provide module membership of genes in (I) iPSC, (P) pre-iPSC, and (M) MEF. Gene names are provided on the left, histone modifications in red–blue heatmaps: (red) enriched; (blue) depleted. (i) Example of genes that transition through a multivalent state (module 7) in pre-iPSC to an active state in iPSCs from a repressive state in MEF. (ii) Examples of gene sets that transition to a multivalent state in iPSC (module 6) through activating modules (module 8, 9) in pre-iPSCs (top) or a repressed modules (module 5) in pre-iPSCs (bottom). (iii) Example sets of genes that acquire transient active modifications in pre-iPSC. (iv) Example sets of genes that display an aberrant activated state in pre-iPSC that is not recapitulated in the starting MEF or endpoint iPSC cell types: (170-Rik) 1700061G19Rik; (201-Rik) 2010002N04Rik.


