
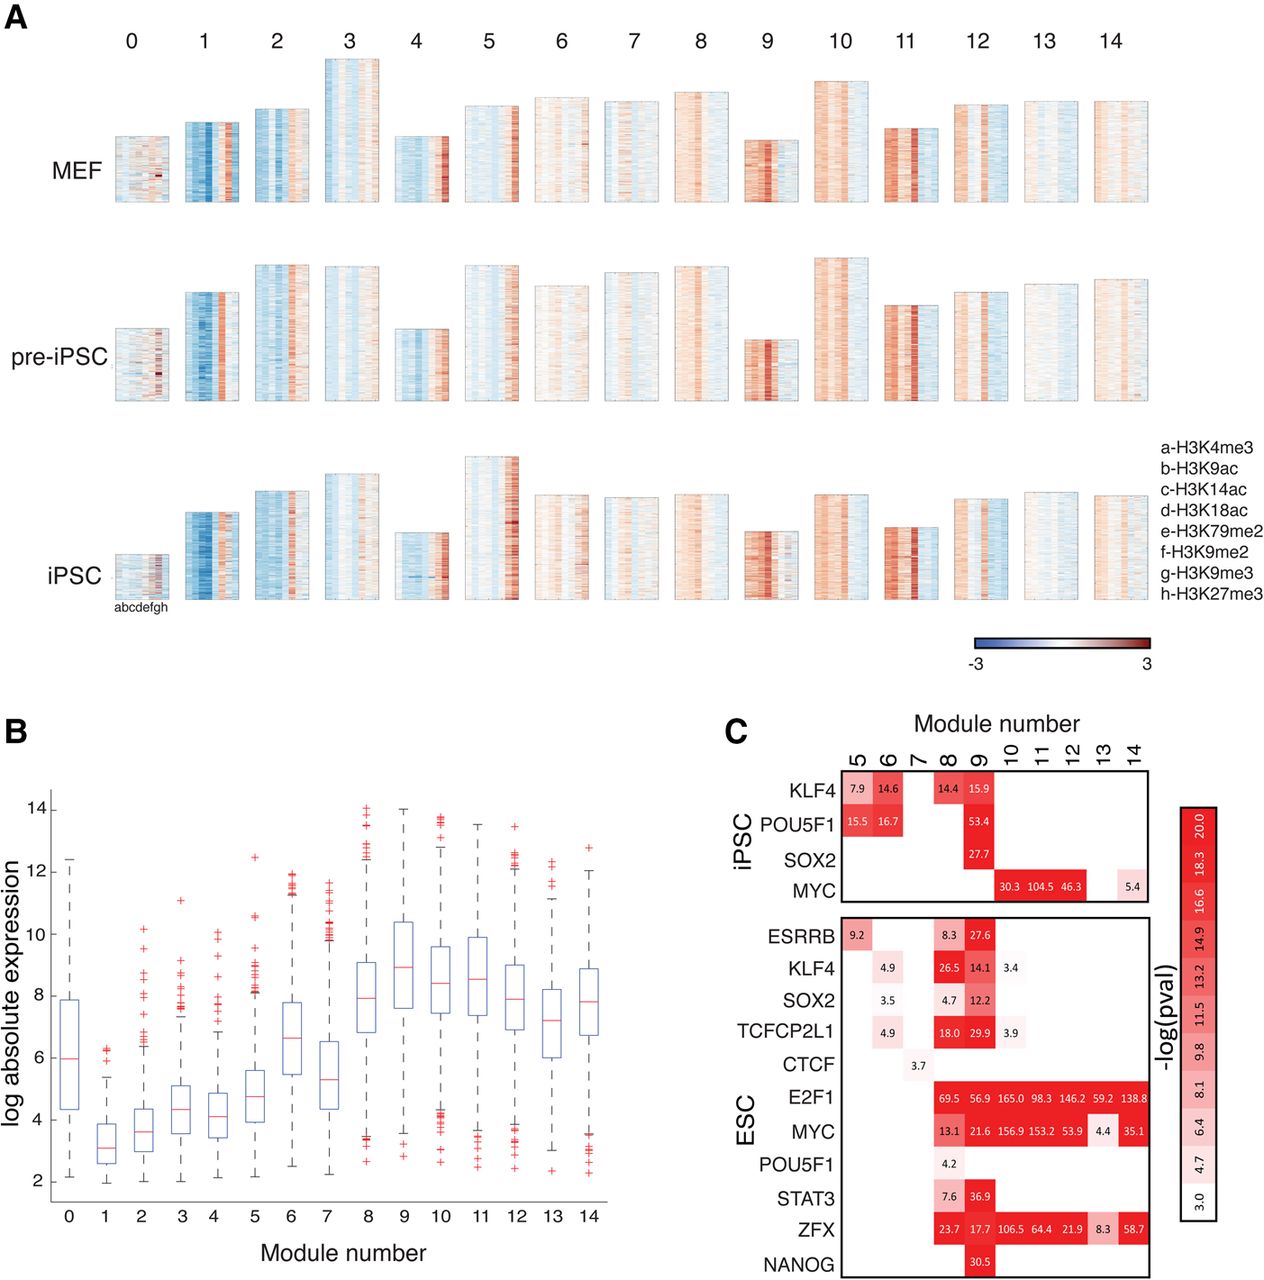
Figure 3.
Chromatin modules in the reprogramming cell types identified by CMINT. (A) Heatmaps of 15 chromatin modules ordered from 0–14, obtained from CMINT: (top) MEFs; (middle) pre-iPSC; (bottom) iPSC. Each row in each heatmap represents one gene; each column represents one histone modification. (Red) enriched; (blue) depleted as compared to input. Height of each module is roughly proportional to the number of genes. (B) Box plots of gene expression of genes in each of the chromatin modules in iPSC. (C, top) Enrichment of reprogramming factors in the iPSC modules based on ChIP-chip data from iPSCs; (bottom) enrichment of pluripotency factors in the iPSC modules based on ChIP-seq data from ESCs.


