
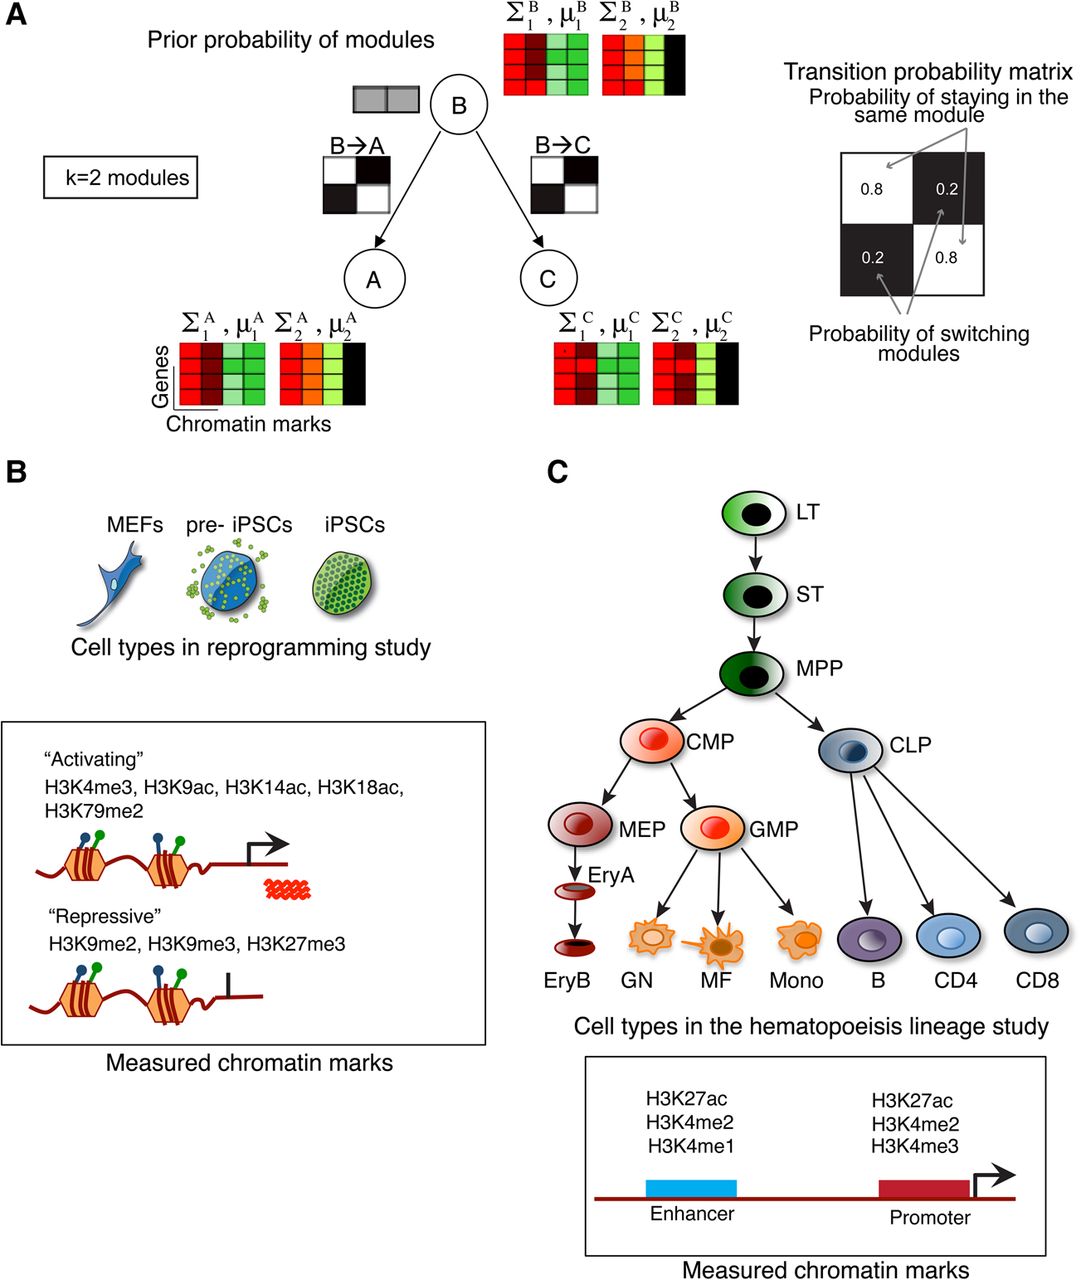
The CMINT approach. (A) The generative model of the CMINT approach. The model is made up of two parts: the first part corresponds to a mixture of P-dimensional Gaussians, one dimension for each mark. The second part specifies the transition probabilities of genes (black-white matrices) switching modules between a cell type and its predecessor. Each circle on the tree corresponds to a cell type. All cell types other than the root cell type (e.g., the starting differentiated cell type) have a k × k matrix of conditional probabilities. The starting cell type only has an initial prior probability distribution of module assignments (gray boxes). (B) The reprogramming system: (MEFs) mouse embryonic fibroblasts; (pre-iPSCs) partially reprogrammed induced pluripotent stem cells; (iPSCs) induced pluripotent stem cells. Bottom: Histone H3 lysine (K) modifications assessed by ChIP-chip analysis, listed according to their association with transcriptional activation or repression when present alone. (C) The hematopoietic system: (LT) long-term hematopoietic stem cells; (ST) short-term hematopoietic stem cells; (MPP) multipotent progenitor; (CMP) common myeloid progenitor; (MEP) megakaryocyte erythrocyte precursor; (EryA) immature erythrocytes; (EryB) mature erythrocytes; (GMP) granulocyte monocyte precursor; (GN) granulocyte; (MF) macrophage; (Mono) monocyte; (CLP) common lymphoid progenitor; (B) B lymphocyte; (CD4) CD4 T lymphocyte; (CD8) CD8 T lymphocyte. Bottom: Histone modifications profiled in Lara-Astiaso et al. (2014) and their known localization pattern.


