
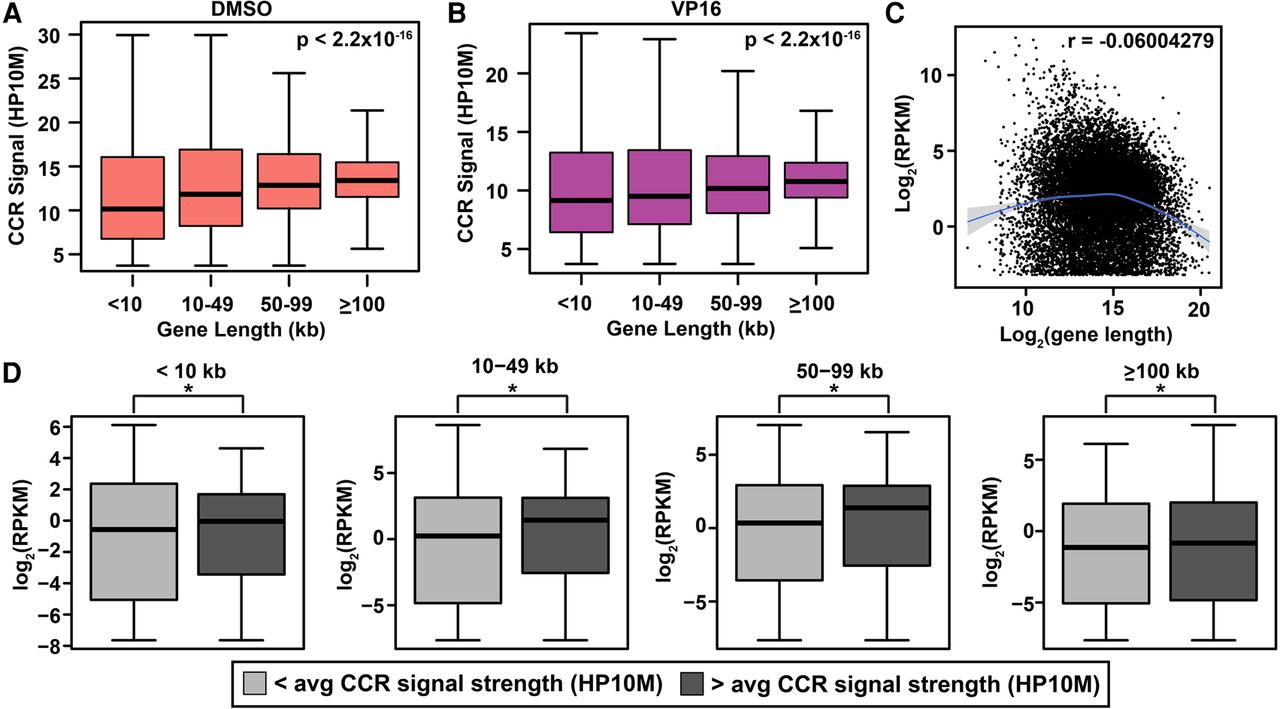
Independent associations of CCR signal strength with coding gene length and transcript abundance. (A,B) Correlation between length and genic CCR signal strength (HP10M) in DMSO-treated (A) and VP16-treated (B) samples. Gene length from GRCh38/hg38 by categories on x-axis. (Boxes) 25th to 75th percentiles; (whiskers) fifth to 95th percentiles; (horizontal lines) median for each length interval. χ2 test P-values, top right in panels. Amplified samples; same treatments merged (Supplemental Table S1). (C) Scatter plot of protein-coding transcript abundance versus gene length based on two RNA-seq data sets for untreated K562 cells (GEO accession number GSE46718) (Bansal et al. 2014) and gene length from GRCh38/hg38. Smooth line was predicted by the gam method (Supplemental Methods). (Shading) Confidence interval around smoothed trend line. Genes with RPKM > 0.1 plotted. r-value (top right) shows slight overall negative correlation. (D) Box and whisker plots of genic CCR signal strength versus transcript abundance within indicated length categories subdivided based on </> average genic CCR signal strength. (*) P < 0.05; χ2 test. Note correlation between genic CCR signal strength and transcript abundance across all lengths. Union set of all amplified samples (Supplemental Table S1).


