
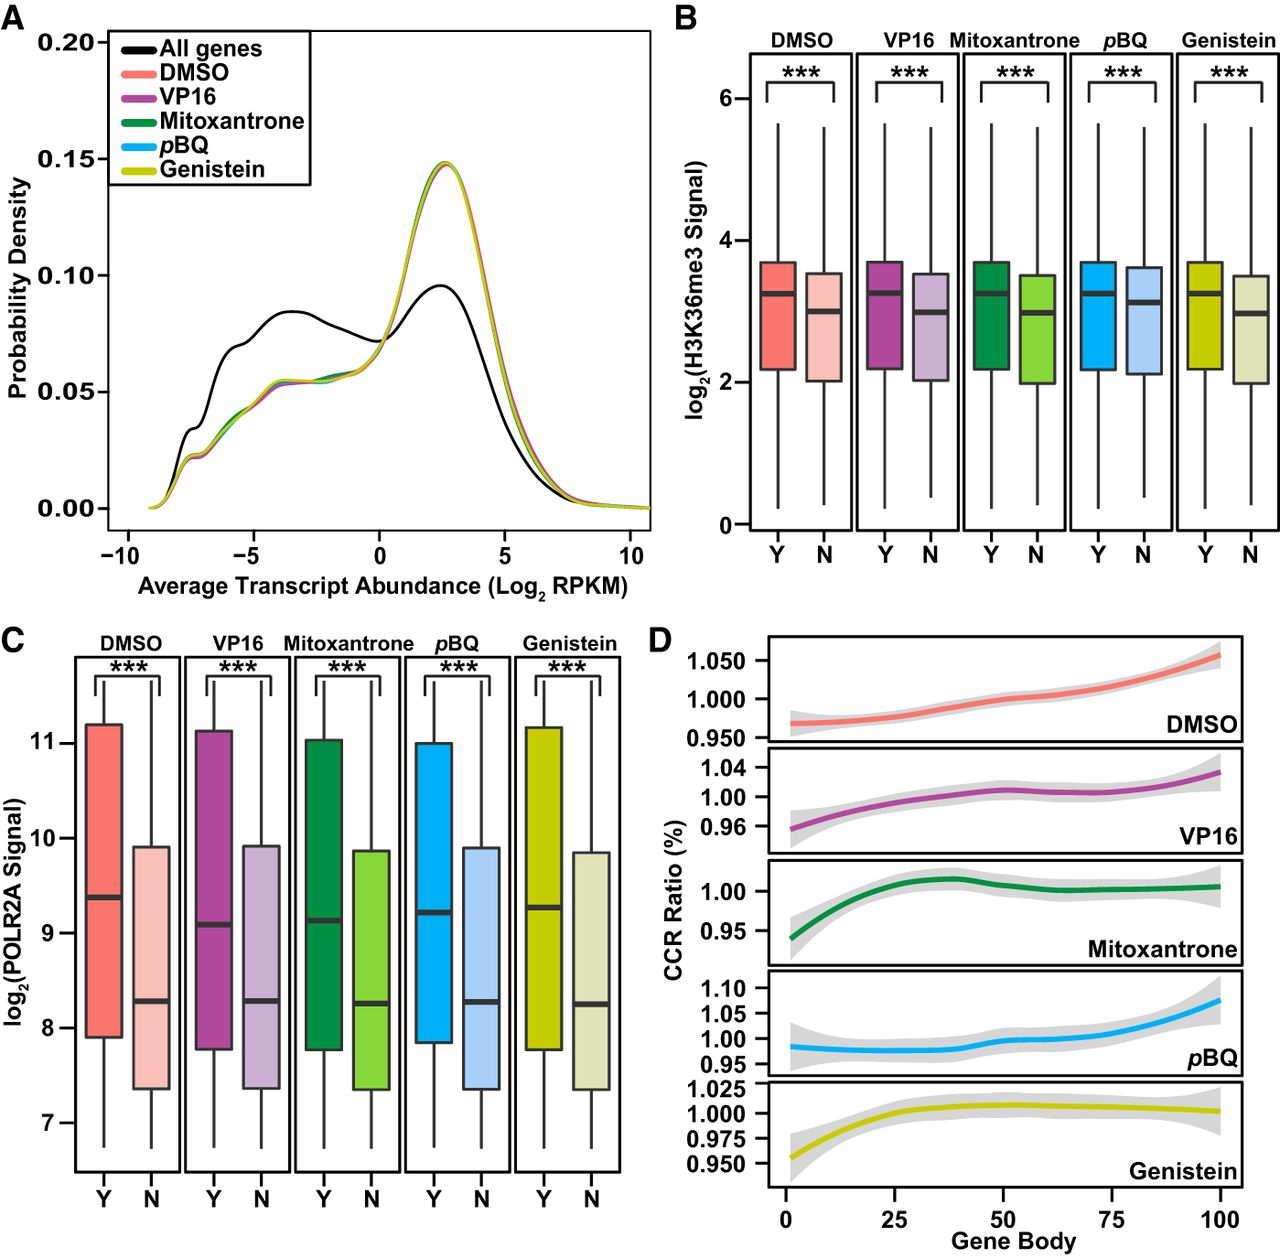
Relationships between TOP2A CCRs and transcription marks in coding genes. (A) Distribution of transcript abundance density for all coding genes compared to coding genes with CCRs. Two RNA-seq data sets for untreated K562 cells (GEO accession number GSE46718) (Bansal et al. 2014) were used to plot transcript abundance. Note skew of CCR-containing genes toward peak with more abundant transcripts (colored lines) compared with bimodal distribution of transcript abundance for all coding genes (black line). P-value for DMSO and each TOP2 poison = 2.2 × 10⁻¹⁶; Kruskal–Wallis test. (B,C) Higher H3K36me3 (B) and POLR2A (C) signals (total mapped reads) along bodies of coding genes with (Y indicates yes; darker colors) compared with without (N indicates no; lighter colors) CCRs. Data from the ENCODE Project Consortium 2012 for H3K36me3 and POLR2A signals (Supplemental Table S4; The ENCODE Project Consortium 2012) were converted from GRCh37/hg19 to GRCh38/hg38 using liftOver (http://genome.sph.umich.edu/wiki/LiftOver) (Hinrichs et al. 2006). (Boxes) 25th to 75th percentiles; (whiskers) fifth to 95th percentiles; (horizontal lines) medians. (***) P < 2.2 × 10⁻¹⁶; Kruskal–Wallis test. (D) CCR distribution along gene bodies divided into 100 equally sized windows. Graphs display CCRs/window relative to total. Note distribution in middle and 3′ ends with DMSO and pBQ and proximal shifts with VP16, mitoxantrone, and genistein. (A–D) Amplified samples; same treatments merged where applicable (Supplemental Table S1).


