
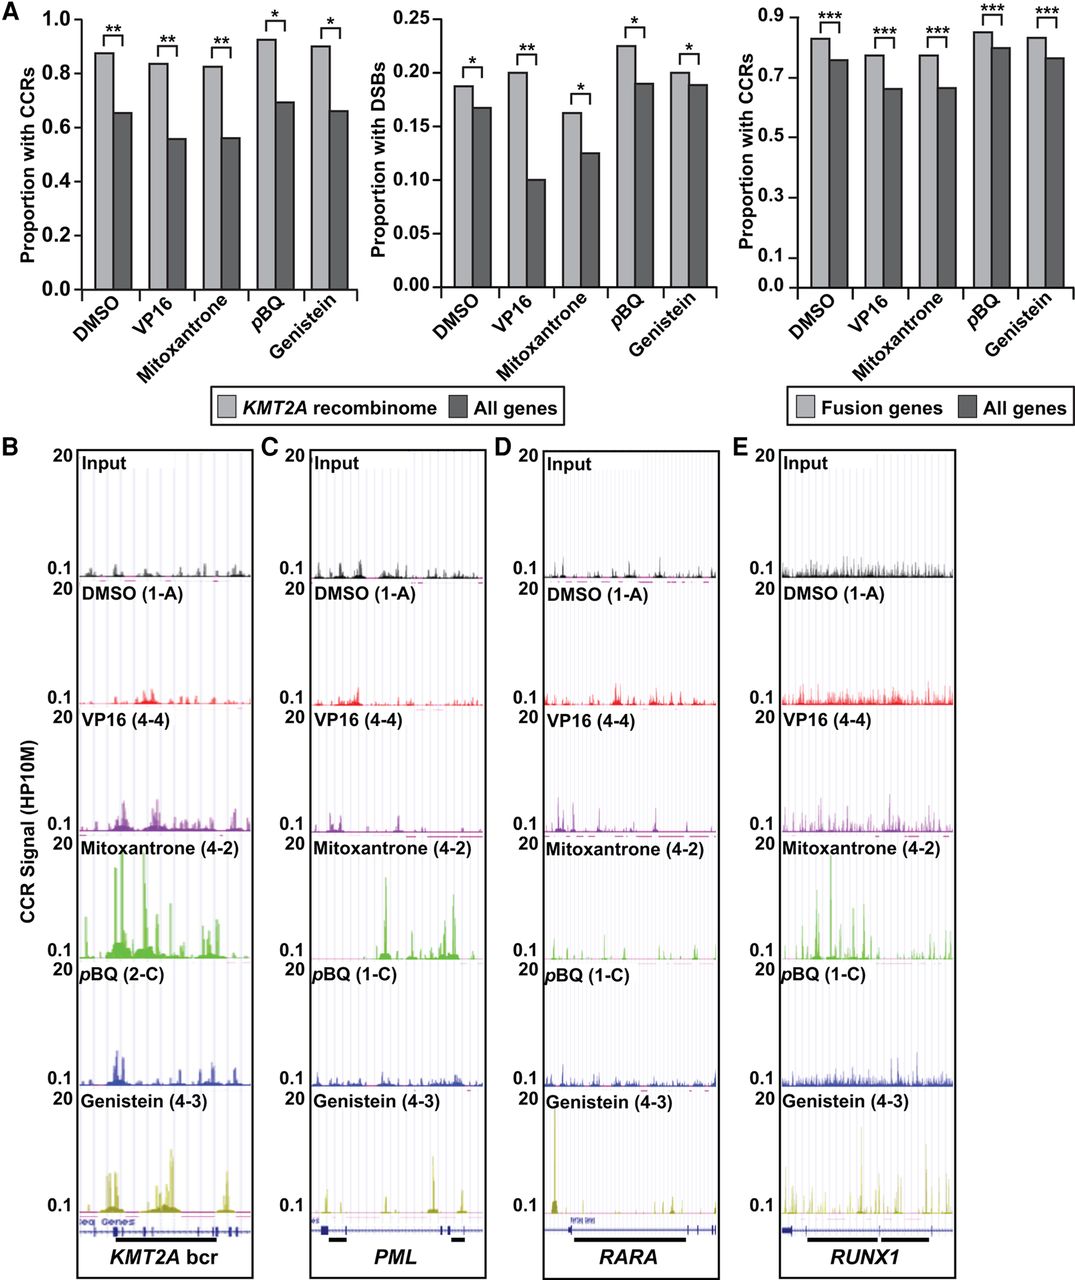
TOP2A cleavage in genes involved in oncogenic translocations. (A, left) Larger proportions of genes containing CCRs in KMT2A recombinome compared with all coding genes. (**) P < 1 × 10⁻⁵ for DMSO, VP16, mitoxantrone; (*) P < 1 × 10⁻⁴ for pBQ, genistein; χ2 test. (A, middle) Larger proportions of genes containing TOP2A DSBs in KMT2A recombinome compared with all coding genes. (*) P < 0.05 for DMSO, mitoxantrone, pBQ, genistein; (**) P = 0.00027375 for VP16; χ2 test. (A, right) Larger proportions of cancer fusion genes (Mitelman et al. 2016) containing CCRs compared with all coding genes. (***) P < 2.2 × 10⁻¹⁶; χ2 test. Amplified samples; same treatments merged where applicable (Supplemental Table S1). (B–E) CCR signals (HP10M) in individual amplified samples along regions of genes involved in leukemia-associated translocations linked to TOP2 poisons (bars). Panels show sonicated input and different treatments (top in panels). Gene models from GRCh38/hg38 in the UCSC Genome Browser (bottom) (Kent et al. 2002; http://genome.ucsc.edu/) correspond to tracks shown. (B) KMT2A. Bar, 8.3-kb bcr spanning exon 7 through exon 13 positions 118,481,830–118,490,167; NC_000011.10. (C) PML. Left bar, 1.45-kb intron 3 bcr, positions 74,023,409–74,024,856; right bar, 1.06-kb intron 6 bcr, positions 74,033,415–74,034,477; NC_000015.10. (D) RARA. Bar, 16.9-kb intron 2 bcr, positions 40,332,397–40,348,315; NC_000017.11. (E) RUNX1. Left bar, 25-kb intron 6 bcr, positions 34,859,473–34,834,602; right bar, 35-kb intron 7 bcr, positions 34,834,409–34,799,463; NC_000021.9.


