
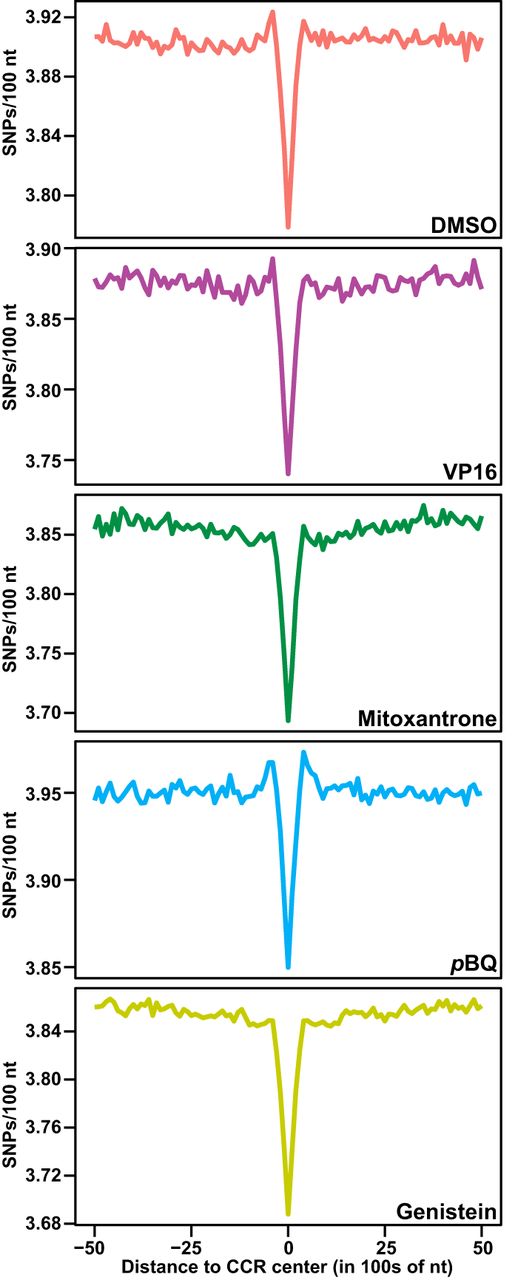
Figure 2.
Regional TOP2A CCR sequence conservation. Lower SNP density within 100 nt at CCR centers compared with the surrounding 10 kb in 100-nt sliding windows. P < 2.2 × 10⁻¹⁶; Kruskal–Wallis test. Amplified samples; same treatments merged where applicable (Supplemental Table S1).


