
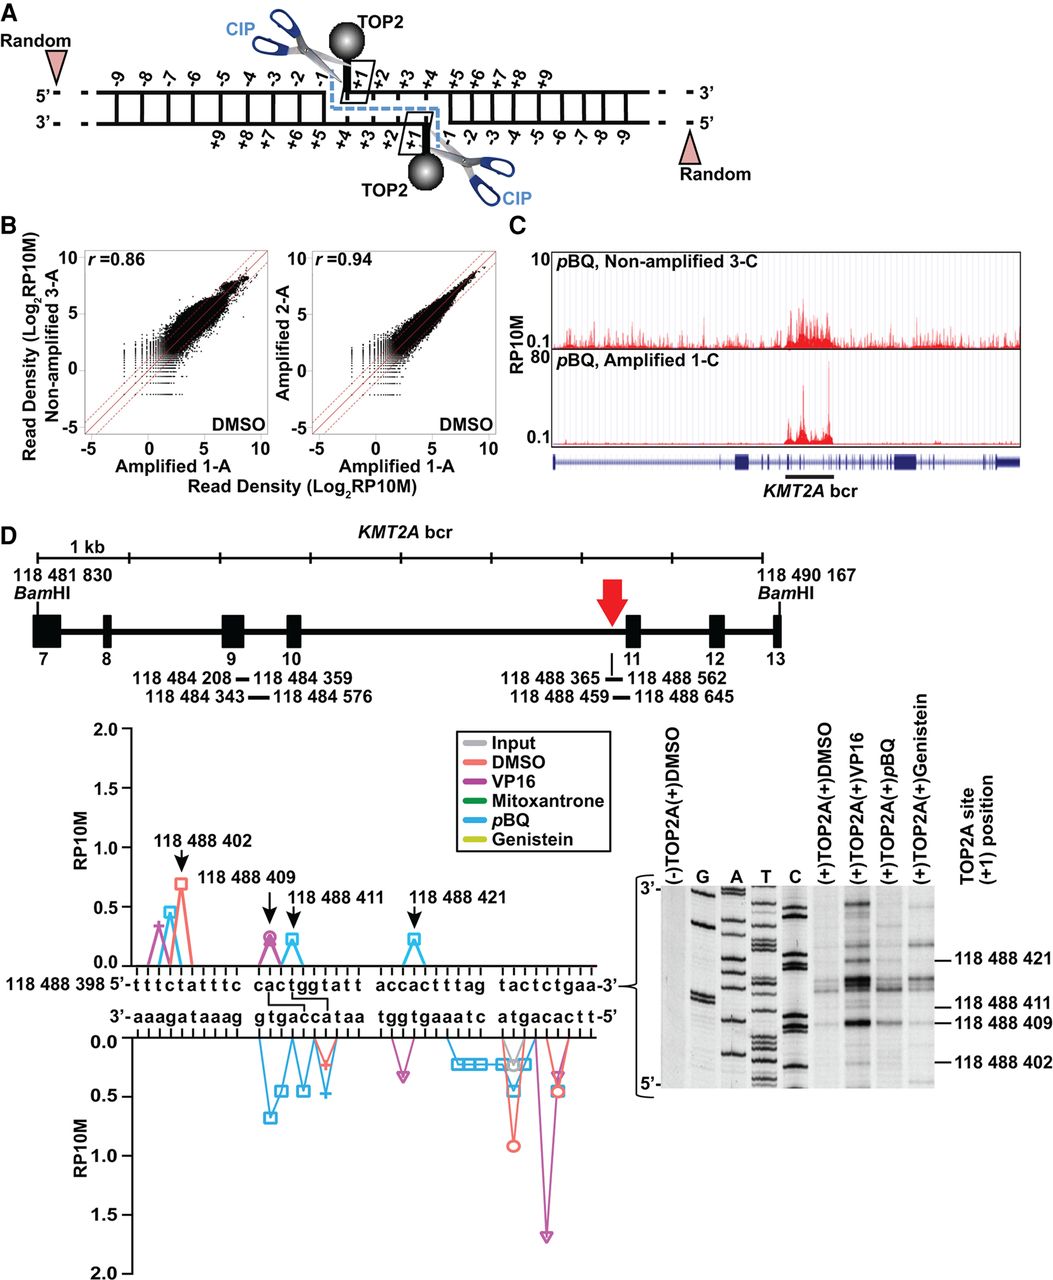
Approach, reproducibility, and assay validation. (A) TOP2 cleavage complexes detected by sequencing. After TOP2 immunocapture, CIP releases covalently attached TOP2 subunits from DNA at the +1 positions relative to the cleavage, which (+/− preamplification) become 5′ adapter-ligated ends; 5′ ends from sonication give random signals. Input control (data not shown) is sonicated lysate with random 5′ ends created by sonication. (B) Strong read count correlations in 10-kb windows between DMSO-treated biological replicates +/− preamplification (Supplemental Table S1). (C) UCSC Genome Browser images and KMT2A gene model (http://genome.ucsc.edu/) (Kent et al. 2002) showing similar read distribution in nonamplified and amplified p-benzoquinone (pBQ)–treated replicates. Black bar indicates bcr. (D) Overlap of TOP2A cleavage sites detected by sequencing with cleavage sites from the in vitro assay. Vertical line beneath the red arrow in the KMT2A bcr schematic is a translocation breakpoint hotspot from the TOP2A high-throughput sequencing assay (bottom, left) and autoradiograph inset from TOP2A in vitro cleavage assay of sense strand of same sequence (bottom, right). Colors indicate different treatments; symbols, different replicates. Arrows at peaks in sense strand (bottom, left) indicate +1 positions of cleavage sites also found in vitro (bottom, right, dashes). Connecting lines indicate sites with cleavage detected at +1 positions of both strands by sequencing (bottom, left). Coordinates, NC_000011.10 (GRCh38/hg38). (VP16) Etoposide. Bars beneath KMT2A bcr schematic, regions from both assays in Supplemental Figures S3 and S4.


