
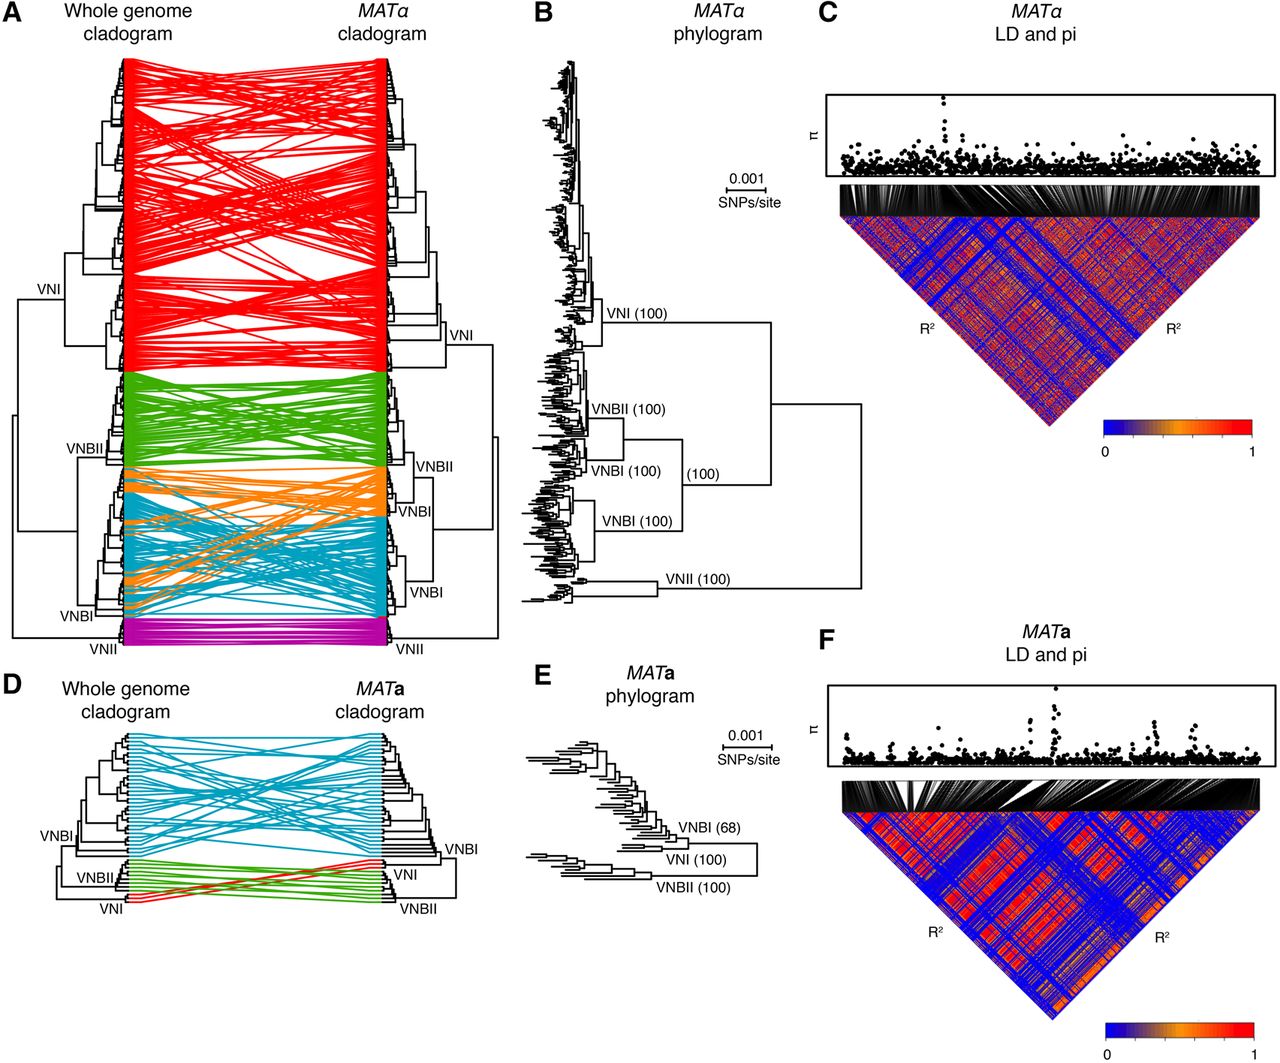
Phylogenetic and linkage analyses reveal distinct evolutionary trajectories of the MAT locus alleles. (A) The topology of the whole-genome phylogeny and MATα phylogeny are compared as cladograms. VNBI isolates contain two distinct α alleles. (B) MATα phylogram showing branch lengths and bootstrap support for major clades. (C) Linkage disequilibrium (R2) and diversity (π) across the MATα locus. (D) Topology of the whole-genome phylogeny and MATa phylogeny are compared as cladograms. (E) MATa phylogram showing branch lengths and bootstrap support for major clades. VNI is a close sister group to VNBI, in contrast to the whole-genome phylogeny, and there is limited support for monophyly of the VNI MATa allele with respect to VNBI (bootstrap support: 68%). (F) Linkage disequilibrium (R2) and diversity (π) across the MATa locus.


