
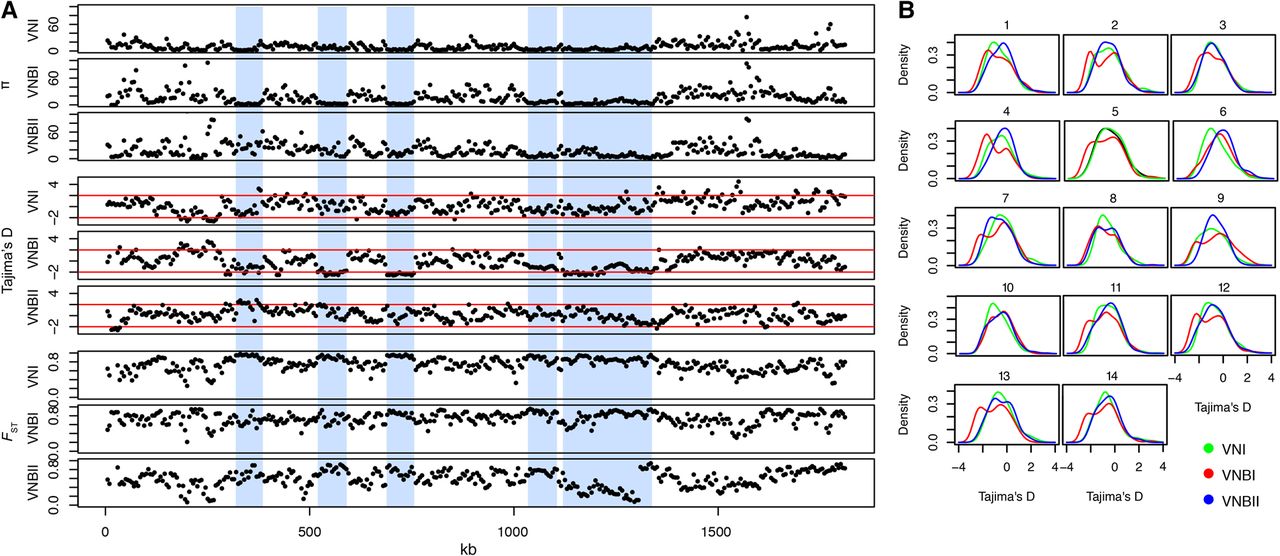
Figure 5.
Population genomic analysis revealed long tracts of low genetic diversity and Tajima's D in VNI and VNBI. (A) Low diversity tracts are shown here in Chromosome 5. In VNBI, these tracts are interspersed between regions of high diversity. Vertical blue bars highlight these areas of reduced diversity and Tajima's D in VNBI, which are generally accompanied by high FST between populations. Statistics shown include π, Tajima's D, and FST. (B) Density distribution of Tajima's D across all 14 chromosomes for VNI, VNBI, and VNBII. VNI and VNBII show predominantly unimodal distributions for most chromosomes, and VNBI shows a bimodal distribution for all chromosomes except Chromosome 6.


