
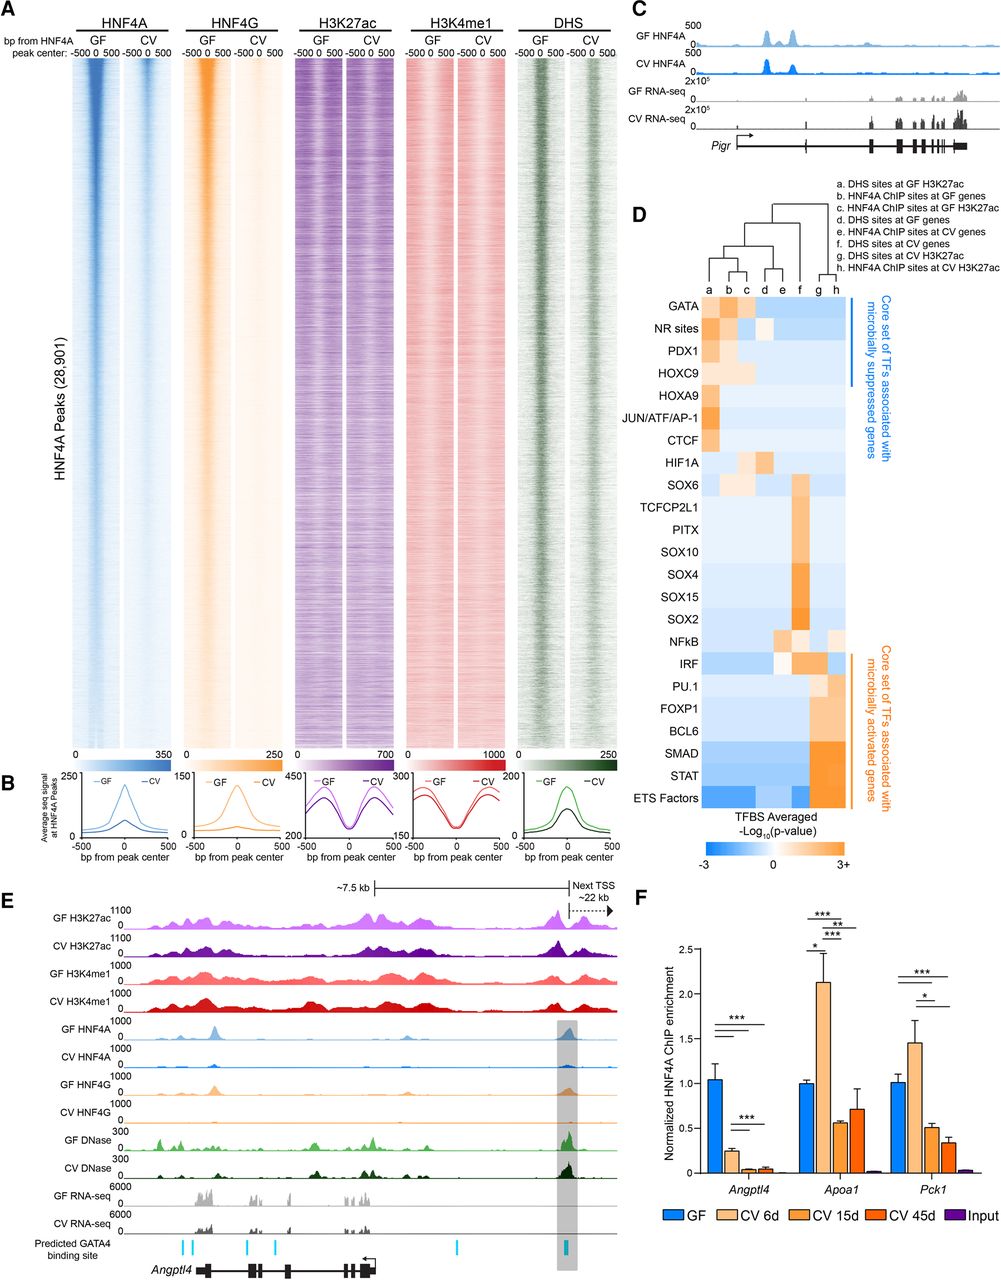
Microbiota colonization results in extensive loss of HNF4A and HNF4G DNA binding in IECs. (A) Heat maps showing the average GF and CV ChIP-seq or DNase-seq signal at the 1000 bp flanking HNF4A sites found in GF. (B) Line plots showing the average GF (light-colored line) and CV (dark-colored line) ChIP-seq and DNase-seq RPKM-normalized signal for the indicated TF, histone mark, or DHS at the 1000 bp flanking HNF4A sites found in GF (HNF4A: n = 3 per condition; HNF4G: n = 4 per condition; H3K27ac: n = 2 per condition; H3K4me1: n = 3 per condition; DNase: n = 3 for CV, n = 2 for GF). (C) Representative signal tracks highlighting a microbiota-induced gene (Pigr, polymeric immunoglobulin receptor) that is associated with an HNF4A peak with similar signal in both GF and CV jejunal IECs. (D) Heat map showing the enrichment of TFBS motifs within 50 bp of the DHS or HNF4A peak maxima. (E) Representative signal track at Angptl4 highlighting two GATA4 sites within an HNF4A-bound region. (F) Bar graph showing HNF4A ChIP-PCR results at Angptl4, Apoa1, and Pck1 loci from jejunal IECs from mice colonized for 0 (n = 2), 6 (n = 3), 15 (n = 2), and 45 (n = 3) d. Data are relative to the GF condition and normalized against a negative control locus (Neurog1). (*) P < 0.5, (**) P < 0.005, (***) P < 0.0005. See also Supplemental Figures S5 and S6.


