
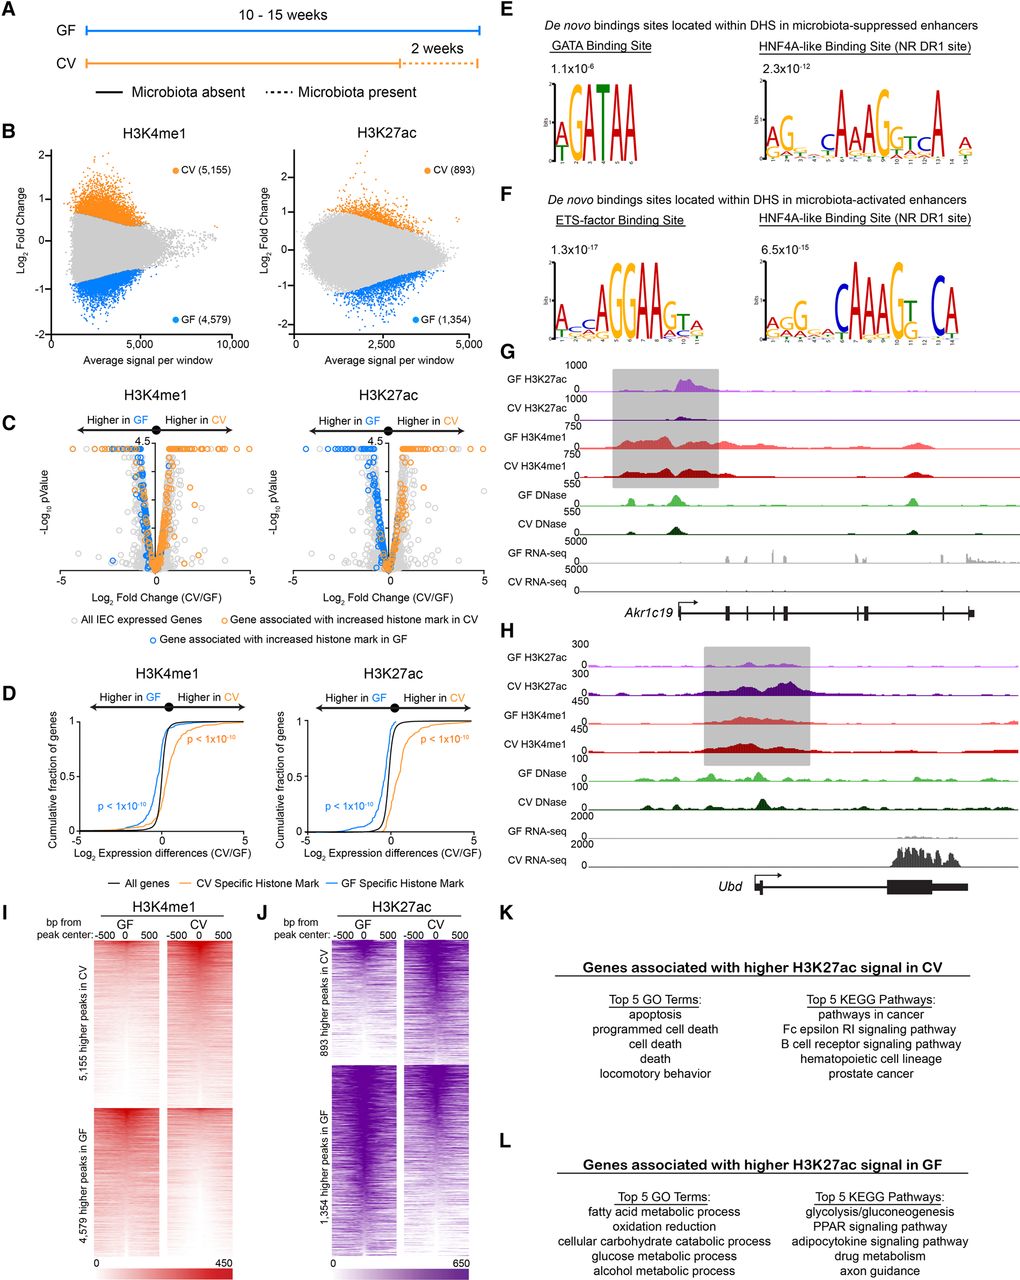
Microbiota colonization results in targeted alterations in enhancer activity near microbiota-responsive genes. (A) Schematic showing the gnotobiotic experimental timeline for testing mRNA levels and chromatin architecture in GF and CV mice. (B) MA plots from DESeq2 analysis (FDR < 0.01) of H3K4me1 (n = 3 per condition) (left) and H3K27ac (n = 2 per condition) (right) ChIP-seq from GF and CV mouse jejunal IECs. Colored dots signify regions significantly enriched for a histone mark in GF (blue) or CV (orange). We found 4579 unique H3K4me1 and 1354 unique H3K27ac peaks in GF and 5155 unique H3K4me1 and 893 unique H3K27ac peaks in CV. (C) Volcano plots showing pairwise comparison of RNA expression between GF (n = 2) and CV (n = 2) jejunal IECs. Blue and orange dots represent genes associated with a region enriched for H3K4me1 (left) or H3K27ac (right) signal in GF or CV. (D) Two-sided Kolmogorov-Smirnov goodness-of-fit test shows a positive relationship on average between the presence of a region enriched for H3K4me1/H3K27ac signal in a specific colonization state and increased transcript abundance of a neighboring gene in that same colonization state. (E) Top de novo binding site motifs found in DHSs that are flanked by regions enriched with H3K27ac signal in GF (E) or CV (F). Representative ChIP-seq tracks highlighting a microbiota-regulated gene associated with differential histone marks in GF (G) (Akr1c19, aldo-keto reductase family 1, member C19) or CV (H) (Ubd, ubiquitin D). Heat maps showing the average GF and CV H3K4me1 (I) or H3K27ac (J) signal at the 1000 bp flanking differential sites. (K,L) GO terms and KEGG pathways enriched in genes associated with differential H3K27ac sites shown in J. See also Supplemental Figure S4.


