
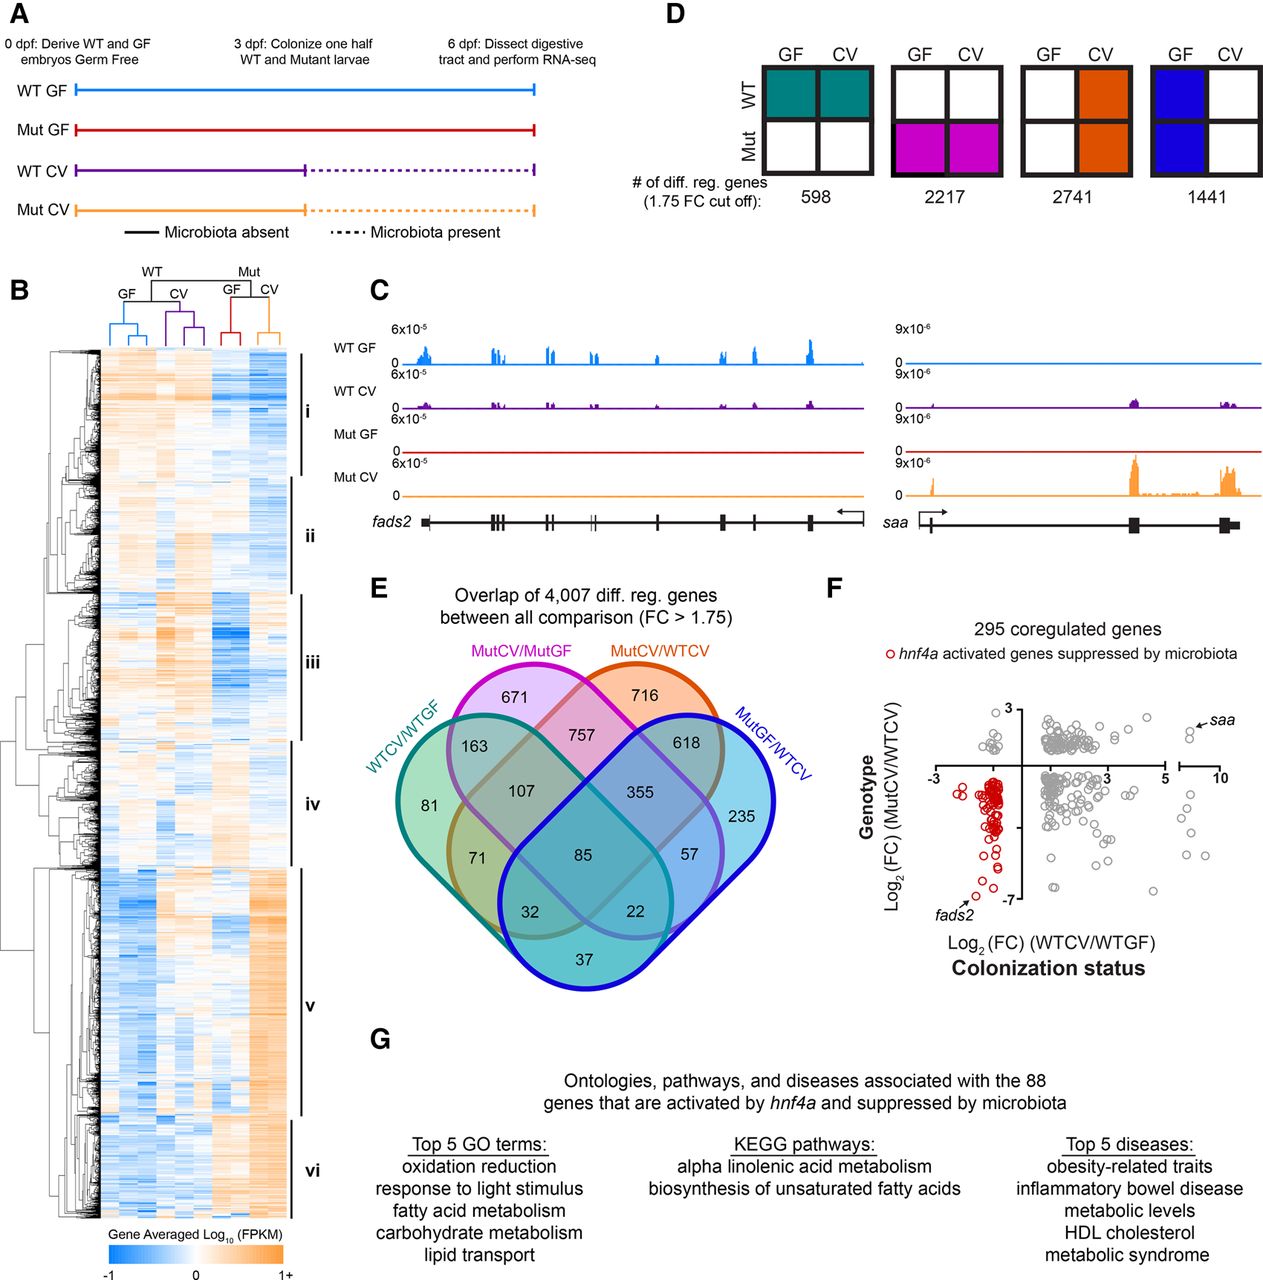
Hnf4a activates the majority of coregulated genes that are suppressed by the microbiota. (A) Schematic showing the experimental timeline for zebrafish digestive tract GF and CV hnf4a+/+ [WT] and hnf4a−/− [Mut] RNA-seq experiment (n = 3 for WTCV and WTGF and n = 2 for MutCV and MutGF). (B) Hierarchical relatedness tree and heat map of differentially regulated genes in mutant and gnotobiotic zebrafish digestive tracts. Gene averaged log10 FPKMs for the biological replicates are represented for each of the 4007 differentially regulated genes. (C) Representative RNA-seq signal tracks at fatty acid-desaturase 2 (fads2) and serum amyloid a (saa) loci. (D) Summary of the total number of differentially expressed genes between indicated conditions (GF and CV) and genotype (WT and hnf4a−/− [Mut]). (E) Four-way Venn diagram showing overlaps between all 4007 differentially regulated genes. (F) The 295 coregulated genes were plotted using the log2 (FC) calculated in the WTGF/WTCV comparison (x-axis) and WTCV/MutCV (y-axis). The 88 out of 98 genes that are activated by Hnf4a but suppressed by the microbiota are highlighted (red) and (G) their GO term, KEGG pathway, and disease associations are listed. See also Supplemental Figure S3.


