
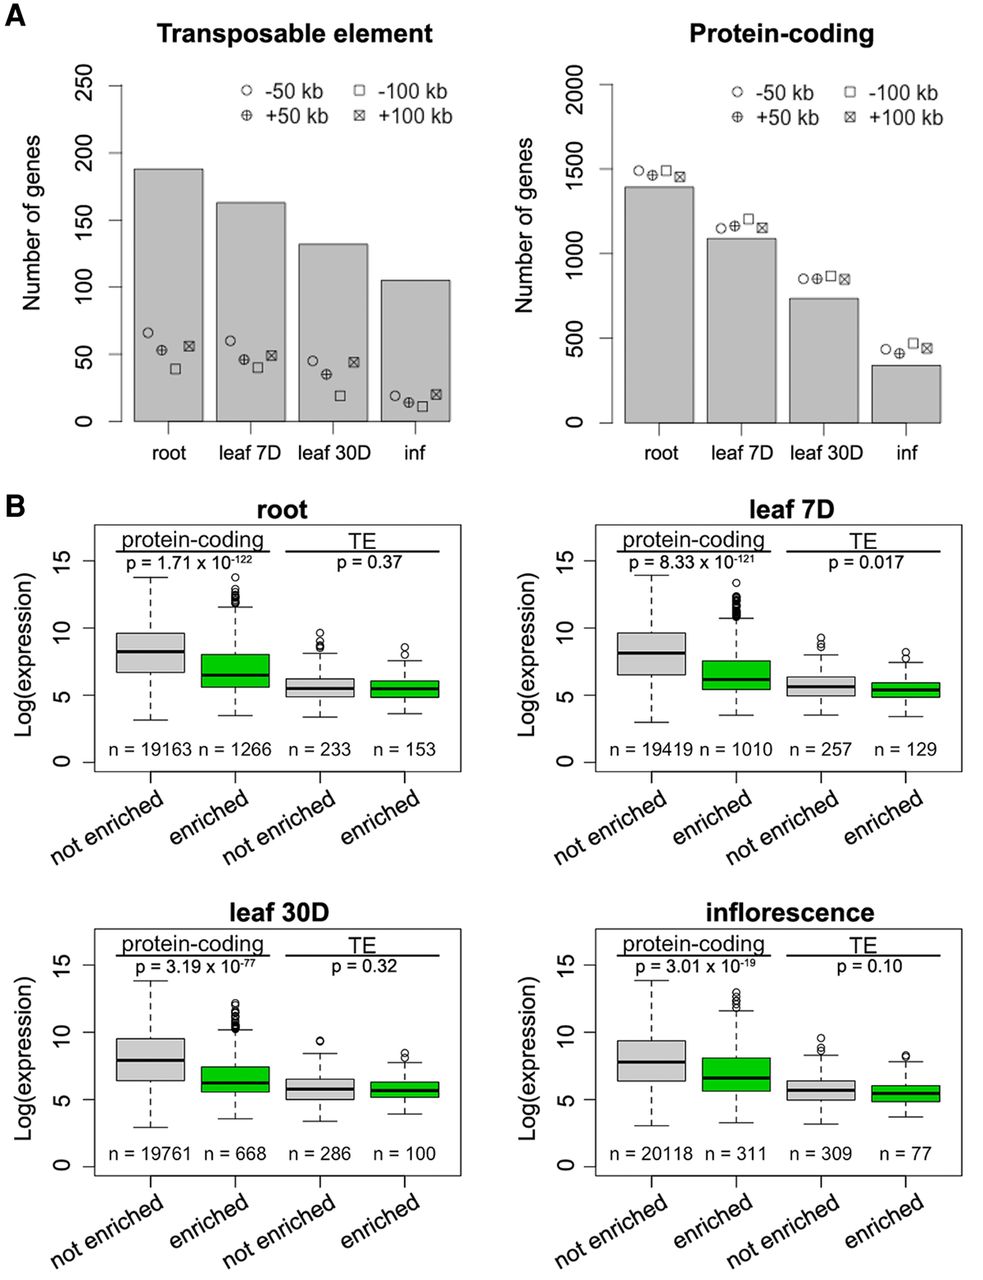
Figure 5.
Enrichment of silenced genes at the nuclear periphery. (A) Number of TE genes (left) and protein-coding genes (right) enriched in different tissues. For each column, the observed number of genes is significantly different (P < 0.001) relative to the permutation-based null distribution of the background (generated as described in Fig. 4C): (inf) inflorescence. (B) Comparison of gene expression levels, which are from a normalized tilling array data set (Laubinger et al. 2008). The P-values indicate Mann-Whitney U test results.


