
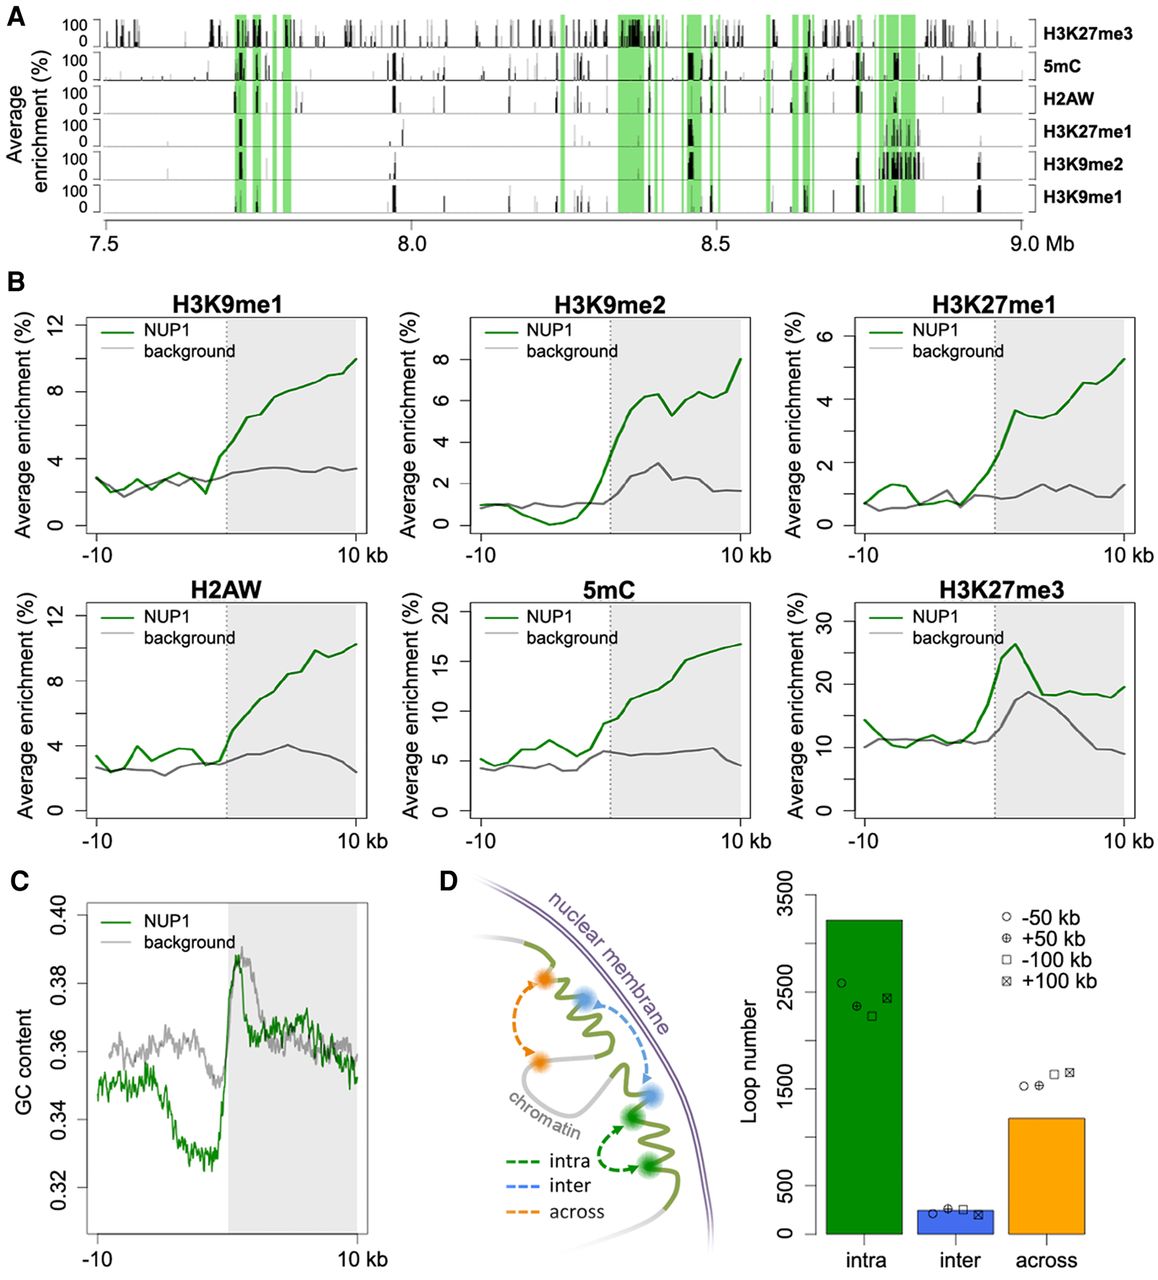
Epigenetic, genomic, and structural features of chromatin tethered at the nuclear periphery. (A) A representative genomic region from Chromosome 1 showing the distributions of NUP1-enriched chromatin identified from 7-d-old leaf tissues (shaded in green) and various epigenetic marks. Average enrichment means the percentage of regions (calculated from 100-bp windows) enriched for the respective epigenetic mark. (B,C) Epigenetic marks (B) and GC content (C) around NUP1-enriched domain borders, shown as a vertical line separating the white and gray blocks. For each plot, the area on the right indicates NUP1-enriched domains (although not all are larger than 10 kb). Average enrichment in B is defined as in A. The GC content in C is in a window size of 100 bp, with a step size of 20 bp. Because enrichment of gene bodies is found inward from NUP1-enriched domain boundaries (see Supplemental Fig. 12), for the background, we randomly picked 3000 genes with the same expression distribution profile as that of NUP1-enriched genes. For these control genes, we extracted the 20-kb regions flanking either their transcription start sites or their transcription termination sites, which were selected randomly. (D) Different types of chromatin loops associated with NUP1-enriched domains (including those in pericentromeric regions). Chromatin loops are from Liu et al. (2016). For both “intra” and “across,” the number of observed chromatin loops are significantly different (P < 2.2 × 10⁻¹⁶) relative to the permutation-based null distribution of the background, which was simulated by shifting the coordinates of NUP1-enriched domains ±50 kb or ±100 kb.


