
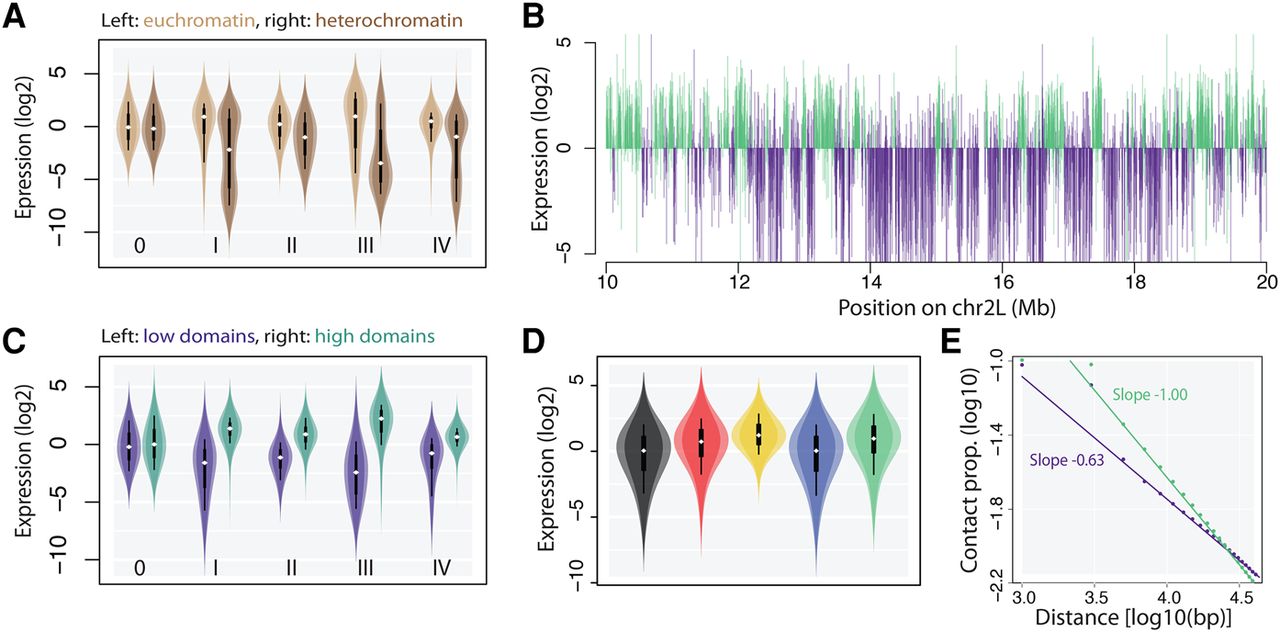
Magnitude of euchromatic position effects. (A) Violin plots showing the expression of reporters inserted in euchromatin versus heterochromatin. All the reporters are expressed at a lower level in heterochromatin (I-IV: promoter number, 0: no promoter control). (B) Expression profile of integrated reporters (each represented by a vertical bar). (Top) Profile of promoter II; (bottom) merged profiles of promoters I, III, and IV. Colors are assigned by a Hidden Markov Model (see Methods). Domains of either high or low expression are clearly visible. The domains coincide between profiles, showing that all the promoters have similar behaviors at the same location. (C) Violin plots showing the expression of reporters inserted in domains of high versus low expression. Labels as inA. (D) Violin plots showing the expression of the reporters inserted in different chromatin types defined as in Filion et al. (2010). The classification explains ∼15% of the variance (F test, P < 2.2 × 10⁻¹⁶). (E) Compaction of the chromatin fiber shown as the decay of contact frequencies. Beyond ∼5 kb, contacts decrease following a power law. Domains of high expression (green) are less compact than domains of low expression (purple). See definition of reporter expression score in Methods.


