
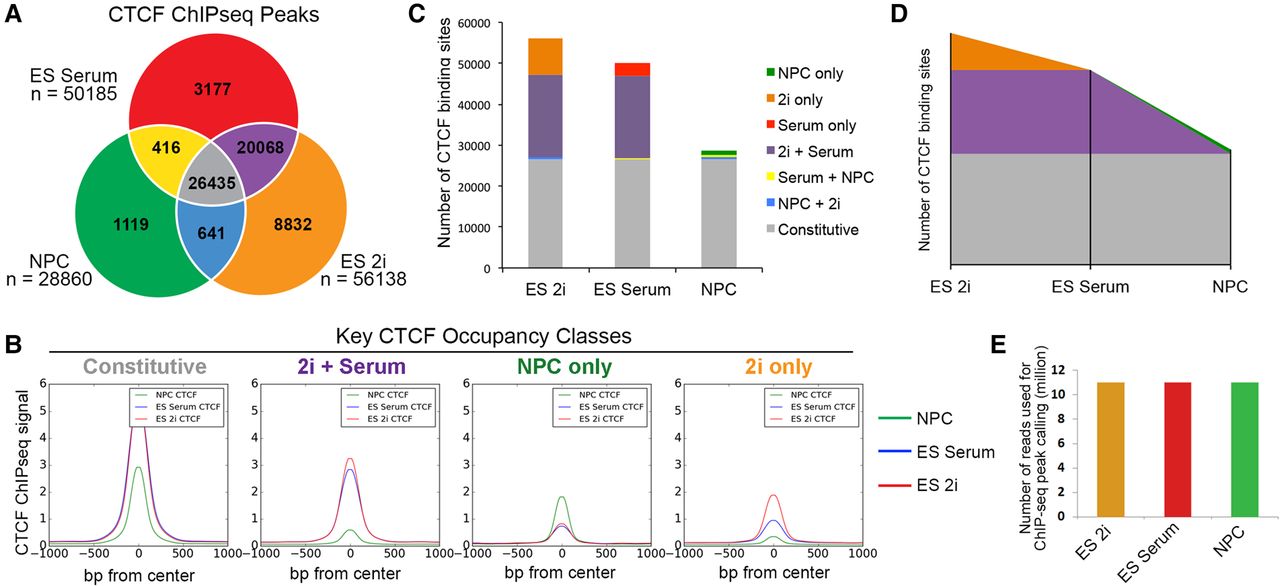
Sites bound by CTCF in NPCs are predominantly preexisting from earlier stages of development. (A) Classification of CTCF binding sites parsed between three developmental cell states. (B) Composite CTCF ChIP-seq signal in NPCs (green), ES serum (blue), and ES 2i (red) centered around the peaks of Constitutive, 2i+Serum, NPC-only, and 2i only CTCF classes. (C) Stacked bar plot representing the distribution of CTCF binding classes across ES cells in 2i, ES cells in serum, and NPCs. (D) Theorized landscape plot depiction of constitutive and dynamic CTCF during the early time points of development. Colors represent same CTCF classes as presented in C. (E) Library read depth is comparable across conditions. After redundant read removal and down-sampling, 11 million reads were utilized for the CTCF ChIP-seq analysis of each cell type.


