
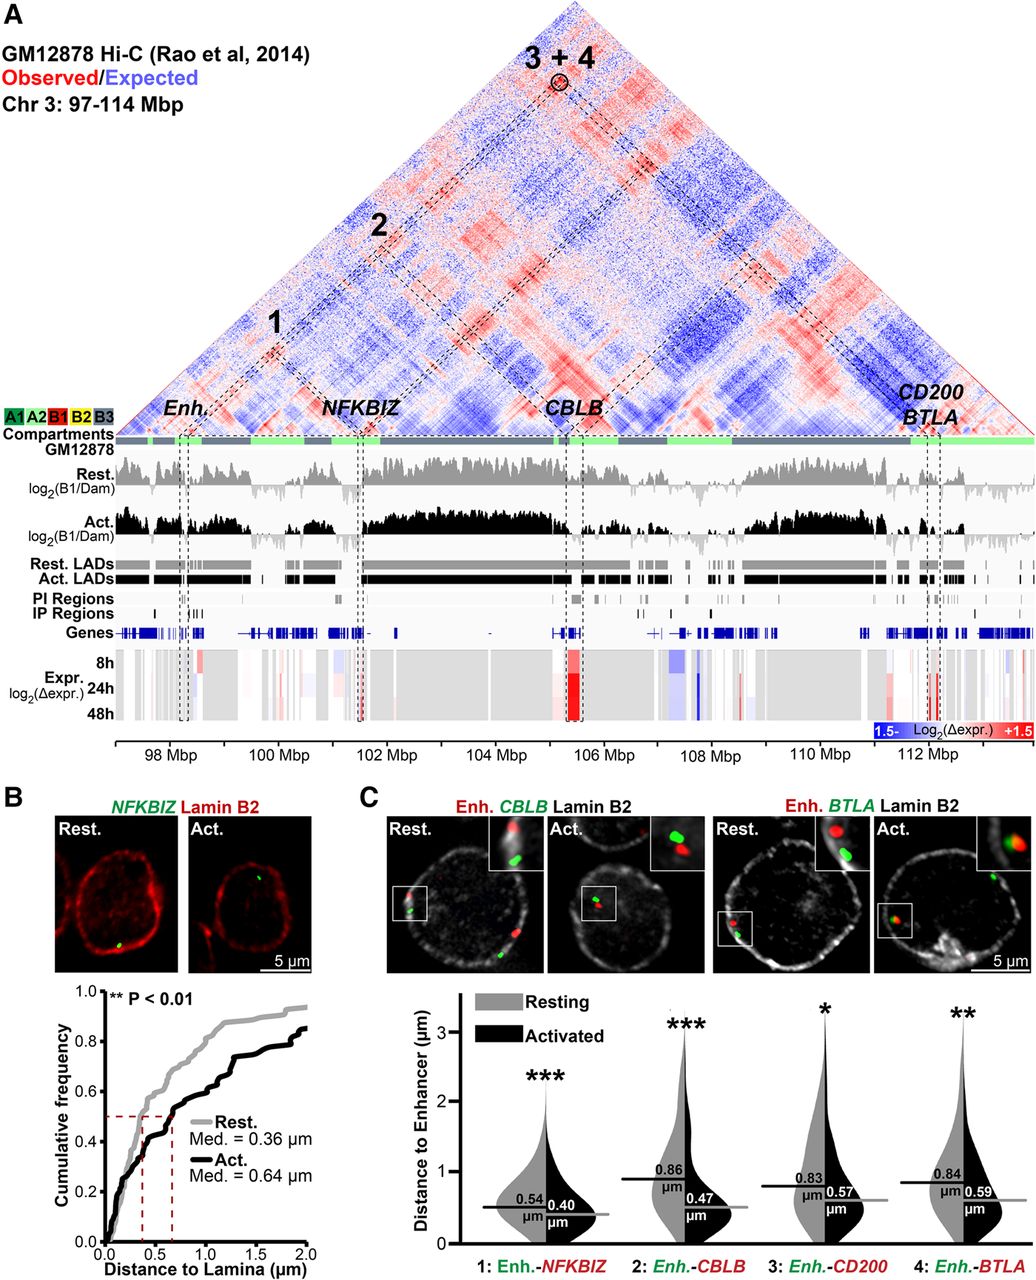
Genes released from LADs during T-cell activation associate in the interior in activated Jurkat T cells. (A) Genomic view of a 17-Mbp region of Chromosome 3 displaying GM12878 cell Hi-C interactions from published contact maps (Rao et al. 2014). Hi-C data are displayed as a heatmap of the ratio of observed versus expected contact frequencies in a distance-scaled model. GM12878 subcompartments (A1, A2, B1, B2, B3) are color-coded directly beneath the map. Tracks are displayed as in previous figures. The black circle represents a highly significant DNA–DNA contact detected by Rao et al. (2014). Several genes—NFKBIZ, CBLB, CD200, and BTLA—and a T-cell activation–specific enhancer (Enh.) display reduced lamina association during T-cell activation concomitant with transcriptional induction and are present in the GM12878 A2 subcompartment. (B) Representative micrographs and quantification NFKBIZ loci positions in resting and activated cells relative to Lamin B2. (C) Representative micrographs and violin plot quantification of distances between the enhancer and indicated genes in resting and activated Jurkat T cells. All enhancer-gene FISH probe combinations display reduced inter-probe distance following activation. For quantification statistics, relative distance measurements between loci or between loci and Lamin B2 were compared between the activated and resting cells by KS tests. (*) P < 0.05; (**) P < 0.01; (***) P < 0.001. Distance measurements were performed on a minimum of 50 nuclei per sample. See also Supplemental Figure S7.


