
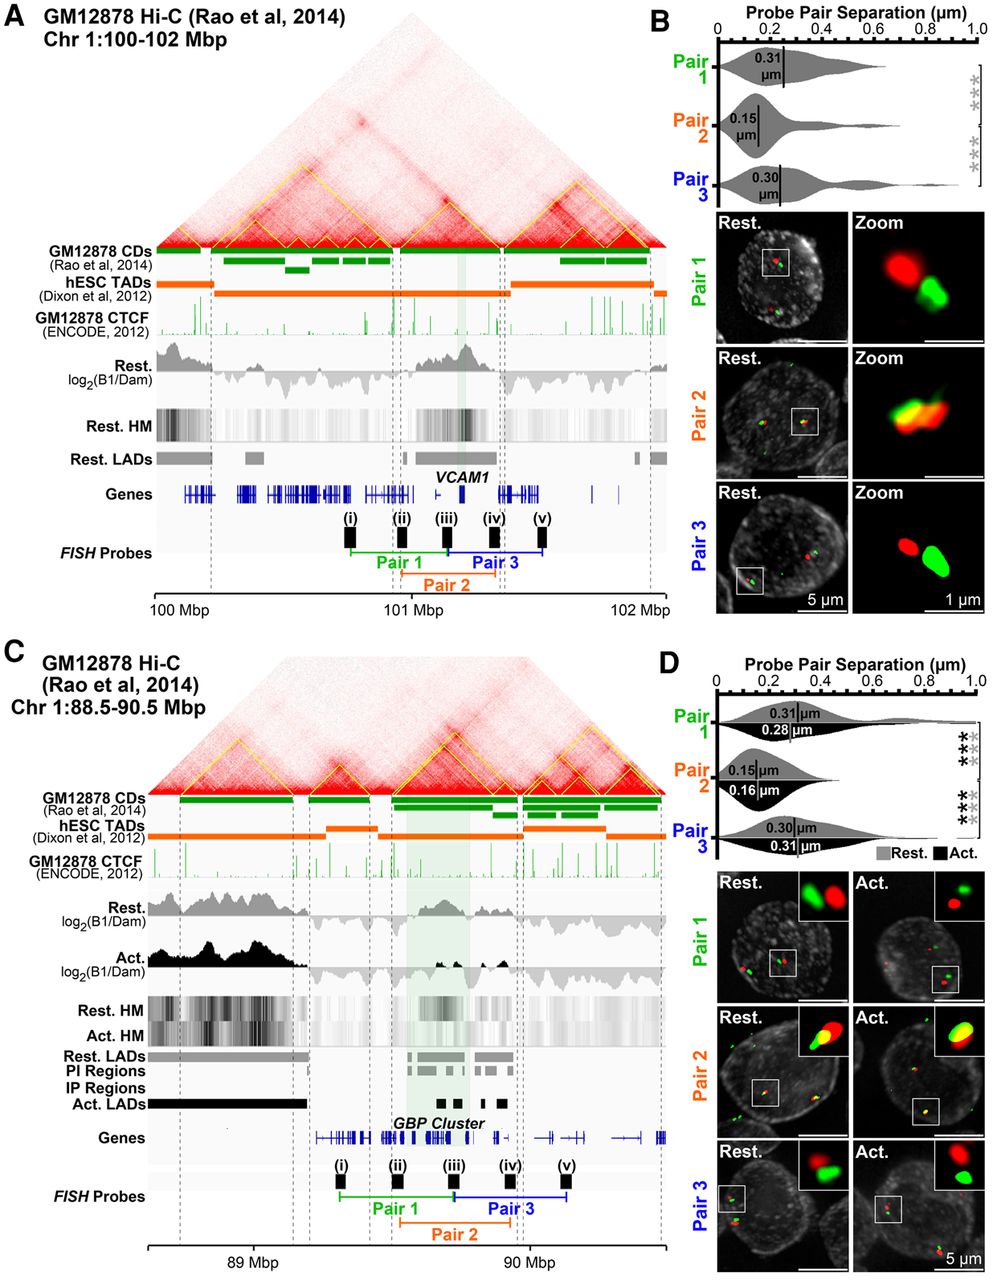
The unit of repositioning is the CD. (A) Genomic region surrounding VCAM1 showing Hi-C data, associated GM12878 lymphoblastoid cell CDs (yellow lines on contact frequency heatmap and green track) (from Rao et al. 2014), and human embryonic stem cell (hESC) TADs (orange track) (from Dixon et al. 2012). Published ChIP-seq CTCF GM12878 cell data (The ENCODE Project Consortium 2012), DamID signals, LADs, and probes and probe pairings tested by FISH are also shown. (B) Quantification and representative max projection images measuring distance between pairs of ∼150-kbp spaced FISH probes. Pairs 1 (i-iii) and 3 (iii-v), containing probe pairings from different CDs, are separated significantly further than pair 2 (ii-iv), a pairing of probes from the same CD. (C) Genomic region view of the GBP gene cluster and probes tested. (D) Similar analysis as B for pairs of ∼175-kbp spaced FISH probes at the GBP locus in resting and activated Jurkat T cells. Probe pairs crossing CDs are similarly separated more than those within the same CD, and these separations remain unchanged during T-cell activation, indicating CD structure is maintained. Quantification statistics were determined by comparing the separation of pairs 1 and 3, with pair 2 in resting (gray) and activated (black) cells by KS tests. (***) P < 0.001. Distance measurements were performed on a minimum of 50 nuclei per sample. See also Supplemental Figure S5.


