
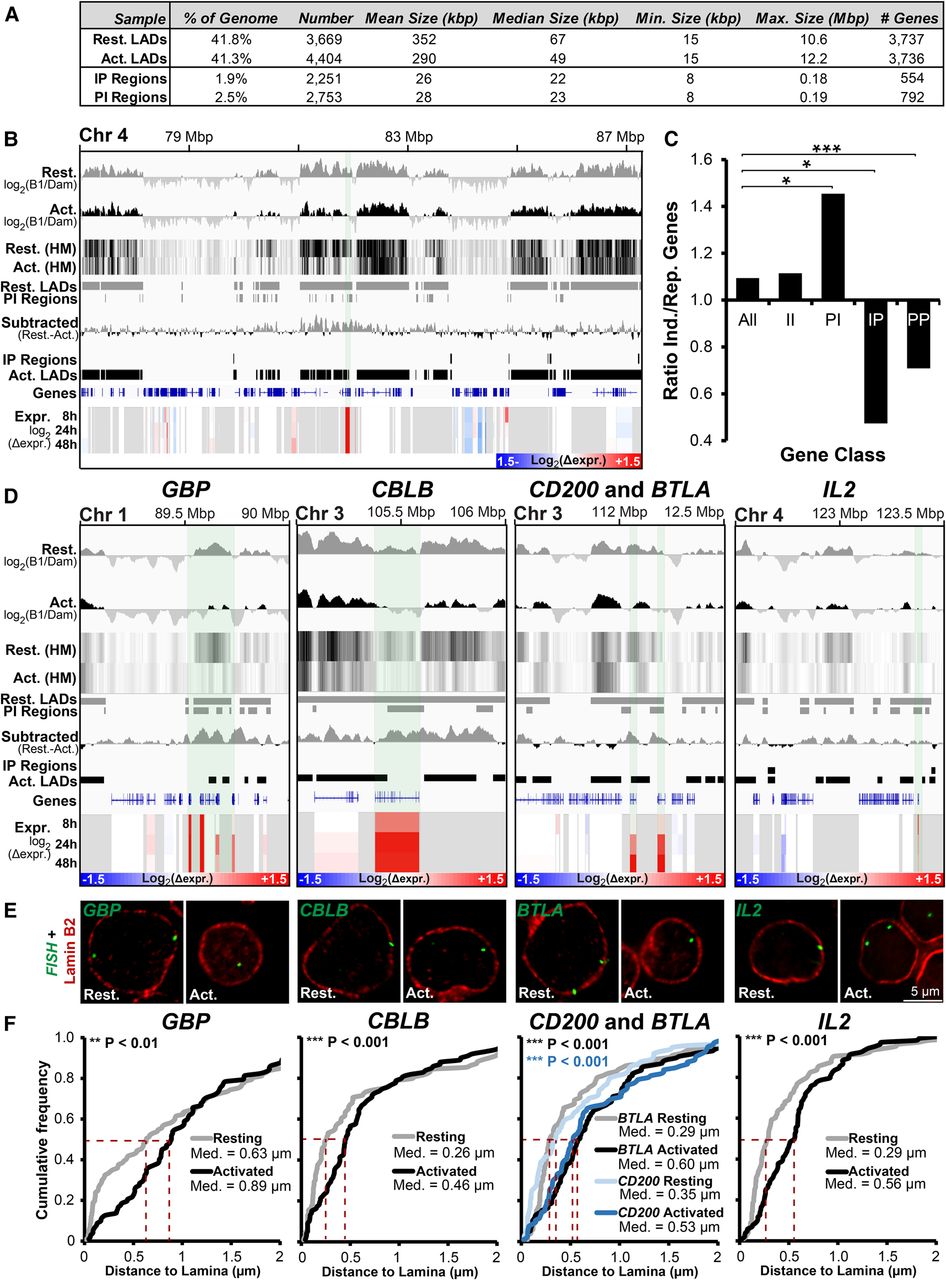
Important genes are released from the periphery during T-cell activation. (A) Summary of LADs, IP (interior-to-periphery), and PI (periphery-to-interior) regions between resting and activated Jurkat T cells. (B) Genomic region surrounding ANTRX2 showing DamID signal bar plots and heatmaps (HM), LADs, IP and PI regions, subtracted resting-activated DamID signal, and expression changes in Jurkat T cells during activation from the resting state at 8, 24, and 48 h. The key for log2(Δexpr.) is given in the bottom right corner. ANTRX2 locus is highlighted by light shading. (C) Ratio of genes induced (Ind.) and repressed (Rep.) during T-cell activation for the whole genome (All), PI, IP, II (genes in the interior in both cell states), and PP (genes peripheral in both states) regions. Statistical significance was determined by Fisher's exact tests. (*) P < 0.05; (***) P < 0.001. (D) Genome browser views for the genomic region surrounding the GBP gene cluster and CBLB, CD200, BTLA, and IL2 loci covering the same parameters as in B. (E,F) Representative micrographs and quantification of gene positions in resting and activated cells relative to lamin B2. Median points are marked with dashed red lines. For quantification statistics, the position of loci in the activated sample was compared with the resting sample by KS tests. (**) P < 0.01; (***) P < 0.001. Distance measurements were performed on a minimum of 50 nuclei per sample. See also Supplemental Figure S4.


