
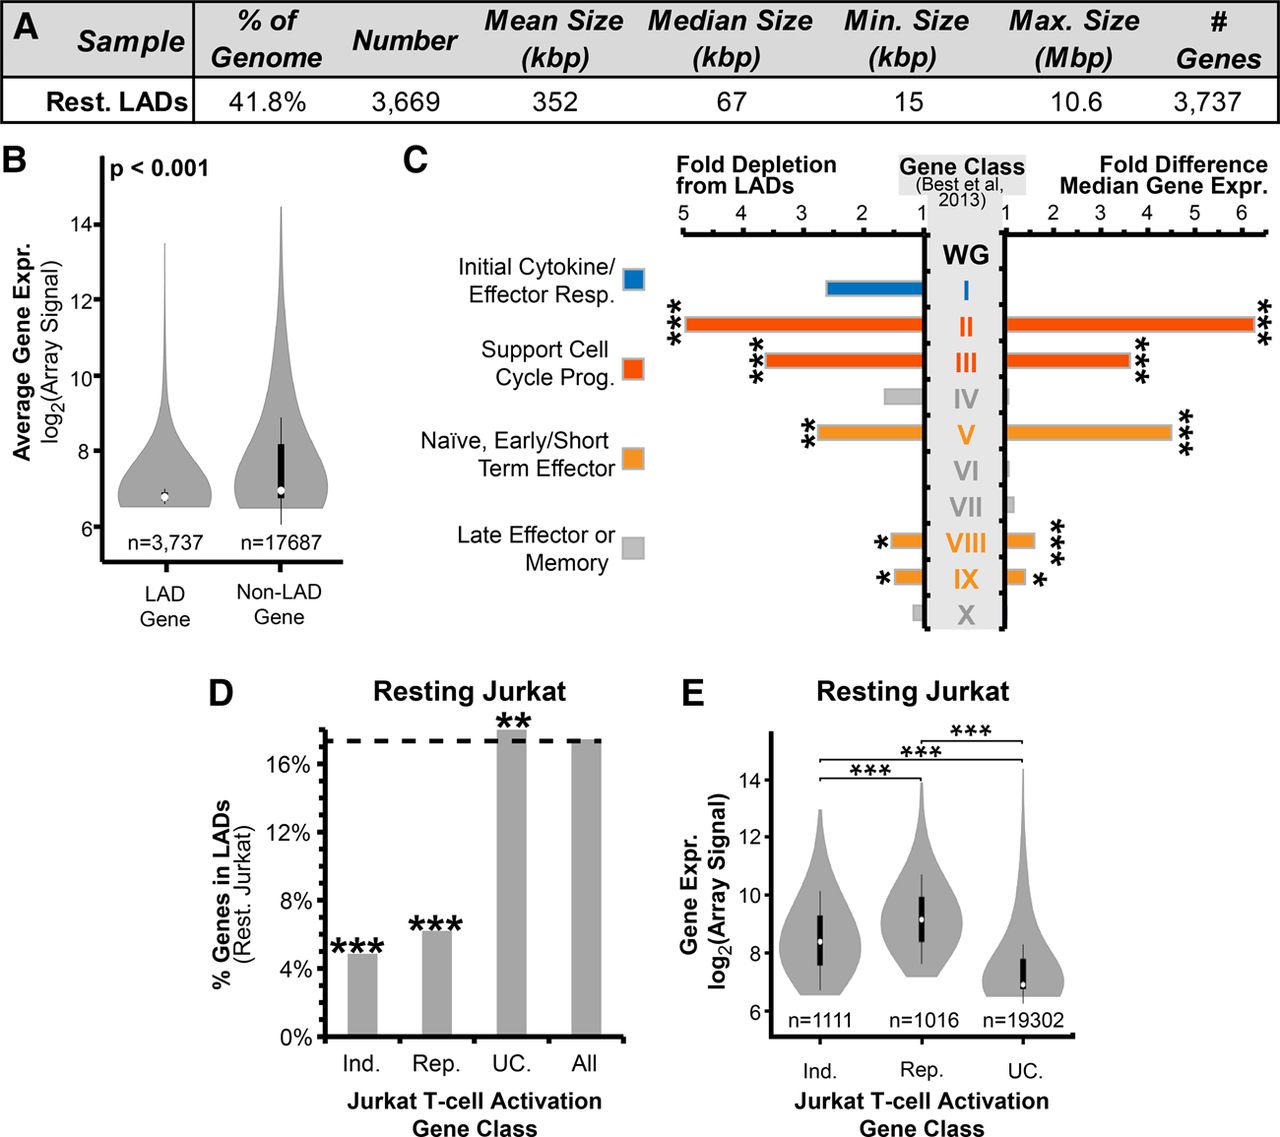
Frequency of lamina association relates to gene expression and function. (A) Summary of resting Jurkat T-cell LAD parameters. (B) Violin plot comparing the microarray-determined signal between genes within LADs and non-LADs. (C) Fold differences in gene expression and frequency of lamina association in resting Jurkat T cells for 10 published categories of genes displaying distinct transcriptional behaviors during T-cell activation (Supplemental Fig. S2; Best et al. 2013). Fold differences were calculated relative to the whole genome (WG) in resting Jurkat T cells. Higher expressed genes tend to be depleted from LADs, such as categories associated with naïve cells, early effector function, and cell division. Lamina association correlated more with late effector/memory functional classes. (D) Percentage of genes in resting Jurkat LADs from different expression categories: genes induced (Ind.) or repressed (Rep.) at least 1.4-fold during T-cell activation, unchanged genes (UC.), and all genes. Both induced and repressed genes are three to four times less frequently found in LADs compared with unchanging genes. (E) Violin plot for expression levels of induced, repressed, and unchanging genes. Both induced and repressed categories are higher expressed than the unchanging genes in resting Jurkat T cells. (B,C,E) Significance of differential gene expression was determined by a Dunn test following a significant Kruskal-Wallis test. (C,D) Lamina-association frequency statistical significance was determined by Fisher's exact tests. (*) P < 0.05; (**) P < 0.01; (***) P < 0.001. See also Supplemental Figures S2 and S3 and Supplemental Table S1.


