
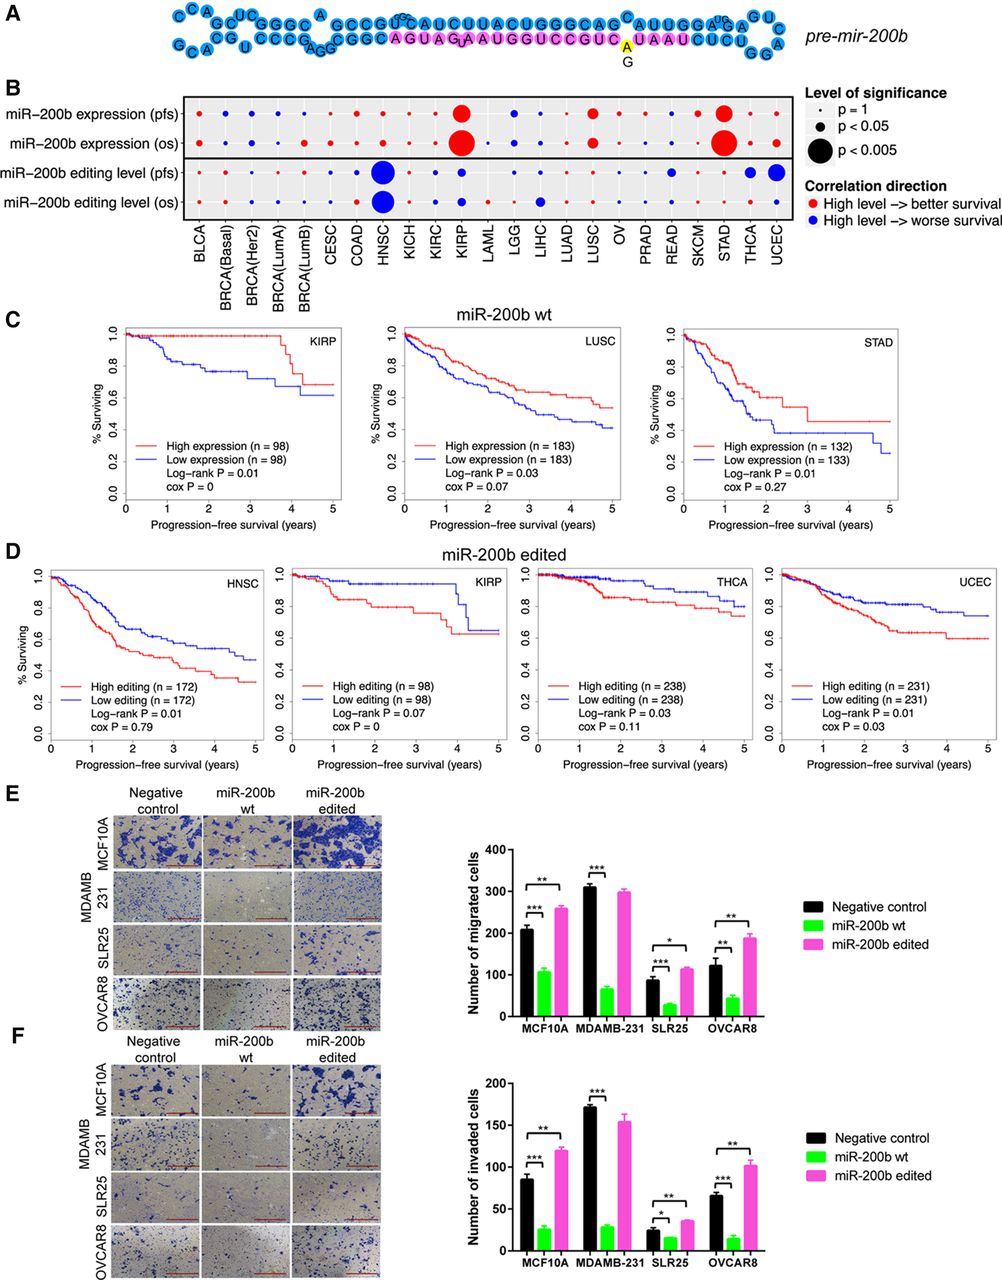
Effects of RNA editing in miR-200b on cell migration and invasion, and correlation with clinical outcomes. (A) Cartoon of A-to-I editing in stem–loop structure of pre-mir-200b. (B) Summary of correlations of WT miR-200b expression and miR-200 editing level with patient survival times across cancer types. Circle size represents statistical significance; color represents direction. In general, high expression of miR-200b is associated with better patient survival; high editing level in miR-200b is associated with worse patient survival. (C) Kaplan-Meier plots of patients grouped by miR-200b expression in individual cancer types. (D) Kaplan-Meier plots of patients grouped by editing level in miR-200b in individual cancer types. (E,F) Effects of miR-200b mimics on (E) migration and (F) invasion in MCF10A, MDAMB-231, SLR25, and OVCAR8 cells (n = 2 or 3). Two-sided t-test was used to assess the difference. Error bars denote ±SEM; (*) P < 0.05, (**) P < 0.01, (***) P < 0.001. Scale bar length is 500 µm.


