
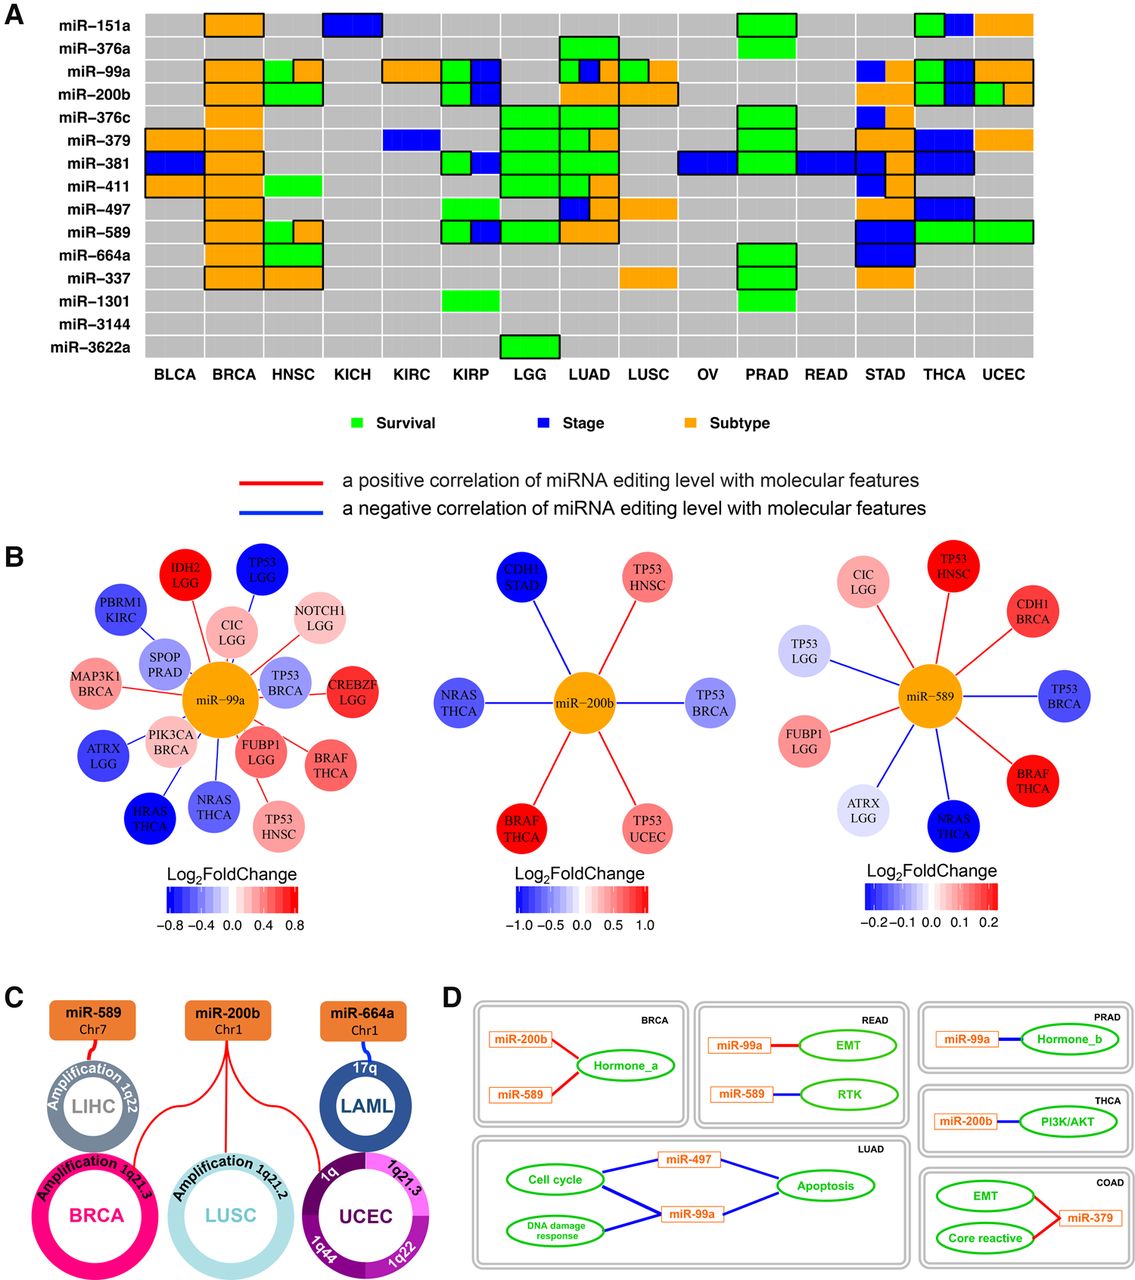
Correlation of miRNA editing hotspots with clinical features, molecular drivers, and signaling pathways. (A) A heat map showing the clinical relevance of miRNA editing hotspots. Significant correlations with tumor subtype (orange, two-sided Wilcoxon or Kruskal-Wallis test), disease stage (blue, two-sided Wilcoxon or Kruskal-Wallis test), and patient survival times (green, univariate Cox proportional hazards model or log-rank test for median-based two-group comparison) (FDR < 0.2); after considering tumor purity, boxes highlight remaining significant correlations. (B) Significant correlations between the miRNA editing levels and significantly mutated genes (the gene nodes are colored according to the fold change between the mutated samples and the WT sample groups; two-sided Wilcoxon test, FDR < 0.05). The specific cancer types showing the significant correlations are listed below gene names. (C) Correlations between the miRNA editing levels and frequent SCNAs (Spearman rank correlation, |RS| > 0.5 and FDR < 0.05). (D) Correlations between the miRNA editing levels and signaling pathway scores (derived from TCGA protein expression data; Spearman rank correlation, |RS| > 0.3 and FDR < 0.05). Red lines indicate positive correlations, while blue lines are negative correlations.


